One of the purposes of these blog posts is to learn. My thinking and thoughts are there with the ability of people to correct, to comment and to learn. This post looks at GI-MAP and Biomesight report for the same person, taken at the same time. The key objectives are:
- Comparing appropriate results between the two (same bacteria only)
- Comparing the suggestions produced from each
- GI-MAP using US National of Medicine Library studies
- BiomeSight using our Special Studies
Foreword – and Reminder
I am not a licensed medical professional and there are strict laws where I live about “appearing to practice medicine”. I am safe when it is “academic models” and I keep to the language of science, especially statistics. I am not safe when the explanations have possible overtones of advising a patient instead of presenting data to be evaluated by a medical professional before implementing.
I cannot tell people what they should take or not take. I can inform people items that appears to have better odds of improving their microbiome as a results on numeric calculations. I am a trained experienced statistician with appropriate degrees and professional memberships. All suggestions should be reviewed by your medical professional before starting.
Simple Back Story
” I got COVID at the end of Sept 2020 and have been much worse ever since.”
We have 2 samples from Biomesight April,2022 and Sept 2022 and will see if the microbiome shifts reflect getting worse
GI-MAP vs BiomeSight
We are comparing different lab results, so reading: The taxonomy nightmare before Christmas… is strongly recommended. While results may disagree, they may be both technically accurate given the testing methodologies.
| Bacteria | GI MAP | BiomeSight Percentile |
| Enterobacter spp. ( Enterobacter) | High | 78%ile |
| Bacteroidetes ( Bacteroidetes) | High | 81%ile |
| Firmicutes ( Firmicutes) | High | 8%ile |
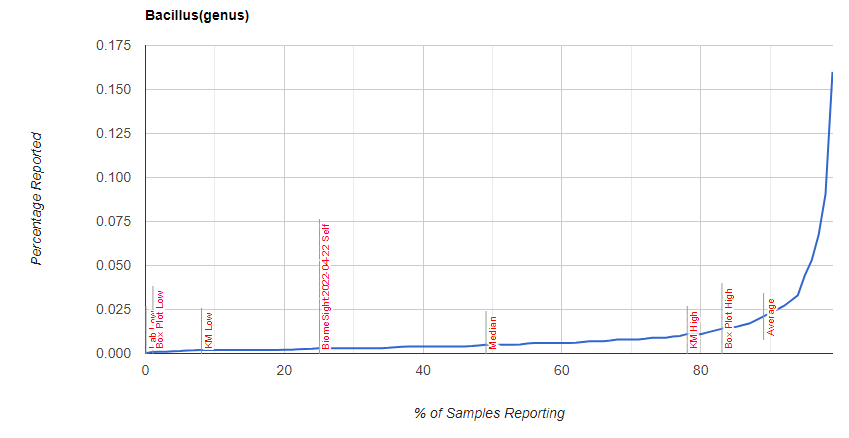
| Bacillus spp. (Bacillus) | High | 47%ile (seen in 66%) |
| Enterococcus faecalis | High | Not reported (Seen in 1%) |
| Enterococcus faecium | High | Not reported (seen in 2.2%) |
| Methanobacteriaceae (family) | High | Not reported (seen in 27%) |
As is seen clearly, there are differences — some very striking (Firmicutes). I will leave it to the test providers to offer explanations on differences of techniques, etc. See Below One of the key issues is how labs handle not detected for determining ranges: some will exclude it from the calculation (thus range IF detected) and others will give it a zero value and include it.
I was curious about Bacillus distribution, which is shown below
Explanation of differences from GI-MAP
COMMENT FROM DIAGNOSTIC SOLUTIONS LAB
Thank you for contacting us and providing an opportunity for us to comment. Metagenomic sequencing has been popular for untargeted characterization of microbiome composition, whereas qPCR is used primarily for accurate quantitation of selected targets (microbes and genes of interest) especially those with particular clinical implications, such as common pathogens and opportunists. Metagenomic sequencing and qPCR are not considered competing methodologies for the same purpose, so it’s not an apples-to-apples comparison.
A major difference between the two methods is the type of quantitation that they provide. Metagenomic sequencing results are expressed as relative abundance (usually as a percentage), whereas qPCR results are expressed as absolute abundance (usually microbial cells per gram of stool). With relative abundance, it’s not possible to directly determine how much of a given taxon (species, genus, etc) is actually present, since its relative abundance is dependent upon the relative abundance of all of the other detected taxa. A couple of example references are included below.
The differences between relative and absolute abundance are likely key factors contributing to any differences in results between GI-MAP and metagenomic tests. From a clinical standpoint, there are demonstrated advantages of using methods, such as qPCR, that provide absolute quantitation, since absolute quantitation has been shown in research studies to be more effective in identifying true correlations with quantitative clinical markers. Examples of clinical markers that are included on GI-MAP include calprotectin, secretory IgA, pancreatic elastase and occult blood.
A quantitative sequencing framework for absolute abundance measurements of mucosal and lumenal microbial communities
https://pubmed.ncbi.nlm.nih.gov/32444602/
“Thus, an inherent limitation of methods that use relative abundance is that they cannot determine whether an individual taxon is more abundant or less abundant (the direction of the change) or by how much (the magnitude of the change) between two experimental conditions or samples.”
Benchmarking microbiome transformations favors experimental quantitative approaches to address compositionality and sampling depth biases
https://pubmed.ncbi.nlm.nih.gov/34117246/
“Our results demonstrated that quantitative approaches performed better than their relative and compositional counterparts when it comes to identifying taxon–metadata associations or studying taxon–taxon interactions. The observed performance gap among the methods profiled widened with increasing unevenness of taxa distributions, as exemplified by our analyses of the blooming scenario.”
Explanation from BiomeSight
As many of your readers know, it is not possible to compare Biomesight and GI MAP directly due to the differences in what and how it is measured. The strength of a 16s test is in the ability to see the overall ecosystem and this technology is widely used today in clinical and academic research, often alongside shotgun or other WGS techniques. It allows for coverage of a range of bacteria that’s not included in more focused PCR tests.
Additionally, Biomesight already has around 400 samples from the long covid community allowing for better profiling of the condition. We have shared around half of these samples’ results with MicrobiomePrescription enabling a strong comparison base.
Here’s some of our blog articles covering our findings from the study:
Suggestions from GIMAP
Without applying PUBMED filtering
All of the above bacteria were used.
With PubMed Filtering
Only the following bacteria was selected. This filtering is not available on the site because the quality of select drops too low (as seen here).
| Bacteria Name | Analysis | Taxonomy Hierarchy Level |
|---|---|---|
| Bacteroidetes | Too High | phylum |
| Firmicutes | Too High | phylum |
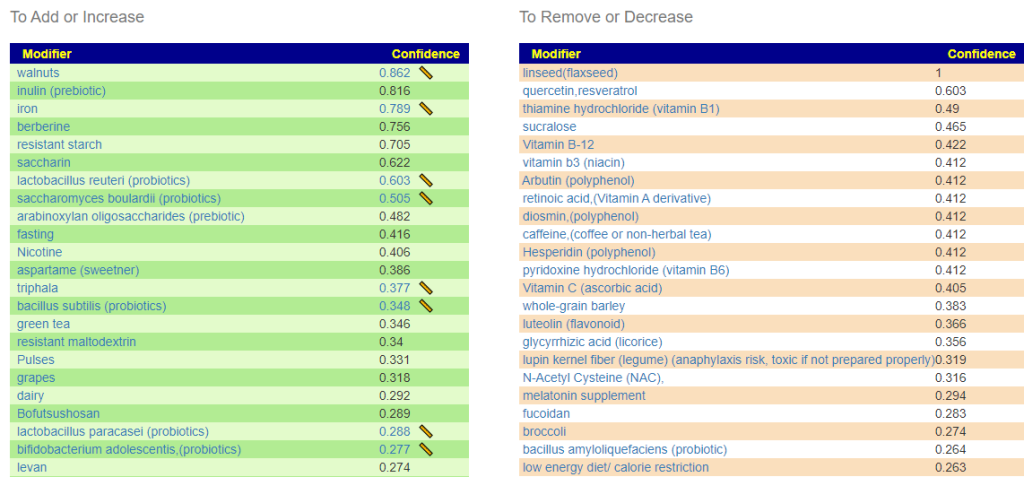
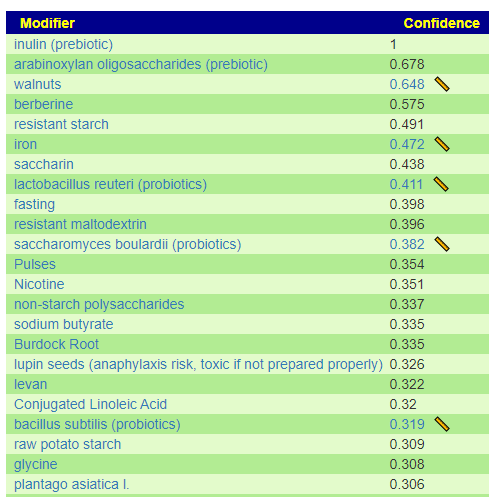
Suggestions from BiomeSight
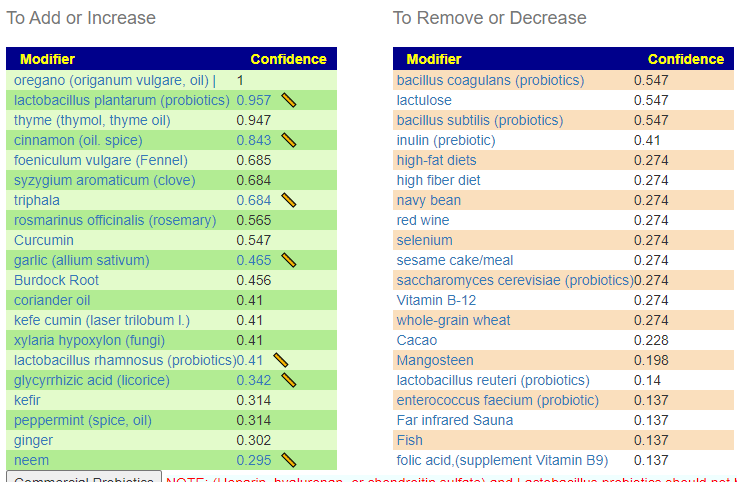
Without Filtering – using Kaltoft-Møldrup for bacteria selection
We have 70 bacteria selected
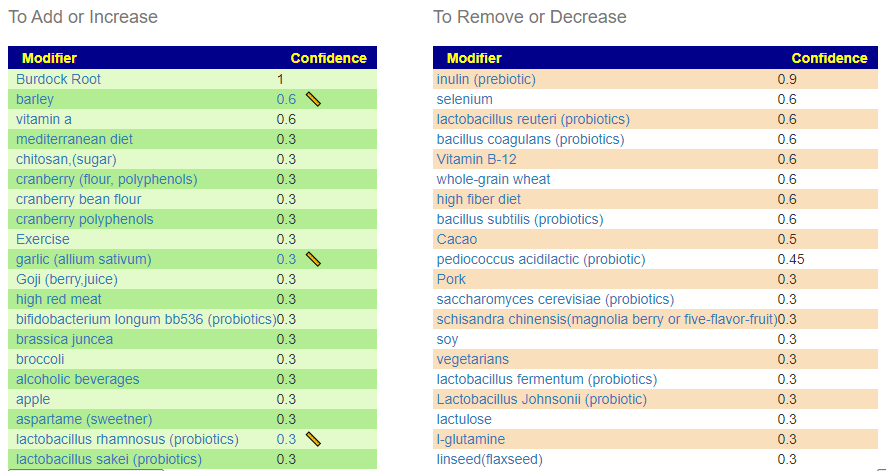
Using Special Studies
We have 93 bacteria selected.
Getting Worst with Long COVID
Taking ME/CFS as a typical pattern, there tend to be three main paths:
- Slow or Spontaneous Remission
- Steady state with waxing and waning
- Slow progressive deterioration, sometimes ending in complete system failue
There are two others, suicide from hopelessness and Remission cause by specific treatment (which was my personal case).
The reader had a early-COVID sample which allows comparisons. It is especially nice that the Lab Read Quality are similar, which makes interpretation more robust.
| Criteria | Current Sample | Old Sample |
|---|---|---|
| Lab Read Quality | 10.3 | 10 |
| Bacteria Reported By Lab | 639 | 507 |
| Bacteria Over 99%ile | 6 | 3 |
| Bacteria Over 95%ile | 26 | 13 |
| Bacteria Over 90%ile | 40 | 26 |
| Bacteria Under 10%ile | 198 | 284 |
| Bacteria Under 5%ile | 173 | 229 |
| Bacteria Under 1%ile | 155 | 161 |
| Lab: BiomeSight | ||
| Rarely Seen 1% | 3 | 7 |
| Rarely Seen 5% | 16 | 25 |
| Pathogens | 34 | 36 |
| Outside Range from JasonH | 10 | 10 |
| Outside Range from Medivere | 19 | 19 |
| Outside Range from Metagenomics | 9 | 9 |
| Outside Range from MyBioma | 7 | 7 |
| Outside Range from Nirvana/CosmosId | 19 | 19 |
| Outside Range from XenoGene | 6 | 6 |
| Outside Lab Range (+/- 1.96SD) | 14 | 8 |
| Outside Box-Plot-Whiskers | 67 | 42 |
| Outside Kaltoft-Møldrup | 181 | 186 |
| Condition Est. Over 99%ile | 0 | 0 |
| Condition Est. Over 95%ile | 0 | 0 |
| Condition Est. Over 90%ile | 3 | 0 |
| Enzymes Over 99%ile | 8 | 0 |
| Enzymes Over 95%ile | 28 | 14 |
| Enzymes Over 90%ile | 52 | 30 |
| Enzymes Under 10%ile | 150 | 240 |
| Enzymes Under 5%ile | 120 | 161 |
| Enzymes Under 1%ile | 90 | 88 |
| Compounds Over 99%ile | 7 | 8 |
| Compounds Over 95%ile | 37 | 101 |
| Compounds Over 90%ile | 146 | 360 |
| Compounds Under 10%ile | 94 | 443 |
| Compounds Under 5%ile | 60 | 162 |
| Compounds Under 1%ile | 35 | 101 |
A summary of the above would be:
- More bacteria are in play over time, post COVID
- More bacteria at extreme high values
- Less bacteria at extreme low values
- No difference seen for canned selection of bacteria ( JasonH thru XenoGene)
- More extreme values seen from Outside Lab Range (+/- 1.96SD), and Outside Box-Plot-Whiskers
- Enzyme production became more extreme over time, after COVID
- Compound production extreme values dropped a lot
This agrees with Special Studies on a large population (n > 150) of long COVID, especially for Compounds. There were no statistically significant compounds detected. There were statistically significant bacteria and enzymes detected.
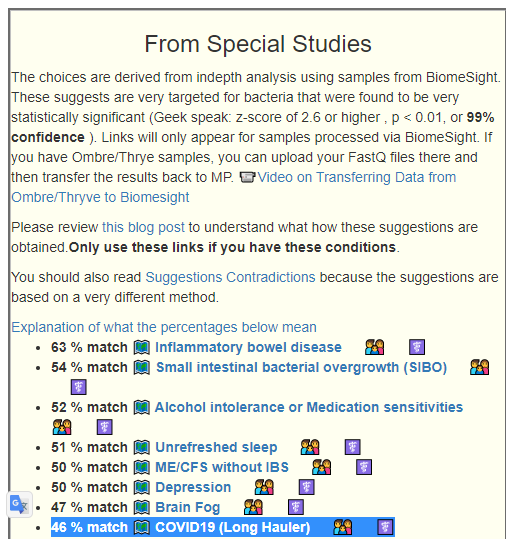
Looking at the From Special Studies, we see that the degree of match for all of the top items have increased significantly (with the lab quality being similar), which is in agreement with “getting worse”
| Older Sample | Latest Sample | |
| Inflammatory bowel disease | 52% match | 63% match |
| Small intestinal bacterial overgrowth (SIBO) | 45% | 54% |
| Depression | 43% | 50% |
| ME/CFS without IBS | 42% | 50% |
| COVID19 (Long Hauler) | 41% | 46% |
| Unrefreshed sleep | 41% | 51% |
Which set of Suggestions is likely best?
Using BiomeSight data with Long COVID with Special Studies is by far the best. It detects 93 different bacteria at a detail level (low hierarchy – species, z-scores for each above 2.6) versus GI-MP with PubMed Long COVID studies which detects just 2 bacteria at the highest hierarchy level (phylum). While GI-MAP may be technically superior, there are two important factors:
- The number of bacteria reported is significantly less in GI-MAP. Ideally, they will, in time, provide a deep report with NCBI numbers available for download or automatic transfer.
- Volume of data and volume of different bacteria has an exponential impact on the ability to detect what has statistical significance.
- We do not have a curated set of samples with Long COVID with GI-MAP. In other words, it does not point to the specific bacteria we should focus on.
Bottom Line
I am going to skip building a consensus here. The Special Studies filter for Long COVID feels right for a starting point. Doing the suggestions for 3 months and then doing a retest would be my way forward (after reviewing with your medical professional)
What we have not touched is probiotics.
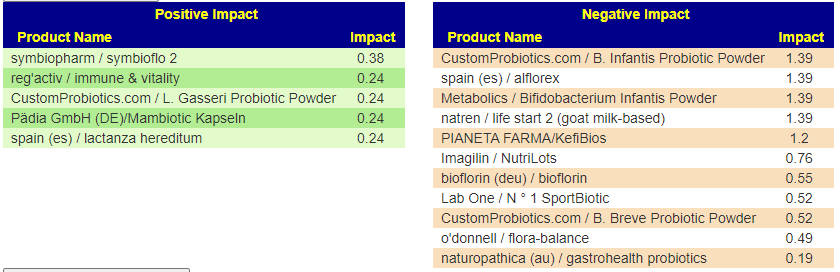
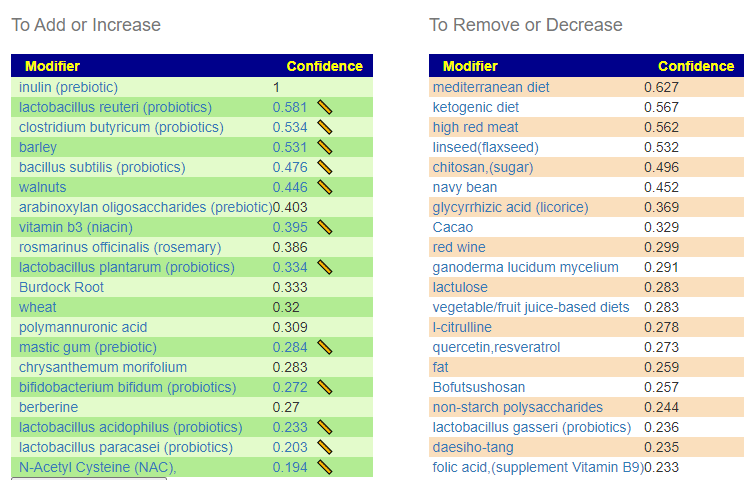
From Special Studies: COVID19 (Long Hauler)
From KEGG data, the top species were Azospirillum lipoferum, Streptomyces venezuelae, Azospirillum brasilense — all sitting in 110-120 range. These are from probiotics like Equilibrium and Prescript Assist (various versions) – Prescript-Assist®/SBO Probiotic sits at the top of mixed impact.
Scanning down the list for familiar names, we see
- Bacillus subtilis subsp. natto, Bacillus subtilis, and other bacillus probiotics in the 75 to 83 range
- Escherichia coli is at 68
- Clostridium beijerinckii is at 63
- Clostridium butyricum is at 55
- Enterococcus faecalis at 40
- Lactococcus lactis at 39
- Lactobacillus plantarum at 36
- Lactobacillus gasseri at 23
- reg’activ / immune & vitality – contains lactobacillus brevis (Levilactobacillus brevis) at 28 and lactobacillus fermentum (Limosilactobacillus fermentum) at 24.3
- Pädia GmbH (DE)/Mambiotic Kapseln – contains lactobacillus fermentum (Limosilactobacillus fermentum) at 24.3
- spain (es) / lactanza hereditum – contains lactobacillus fermentum (Limosilactobacillus fermentum) at 24.3
Remember: The above are specific species, you may wish to view the Probiotic Mixtures page to see which species are in each mixture. My take for simplicity would be: Prescript Assist, Symbioflo-2 (E.Coli probiotic), miyarisan (Clostridium butyricum) and one of those listed above containing lactobacillus fermentum (Limosilactobacillus fermentum).
Reminder: One set of probiotic suggestions is obtained from the (very few) studies using the probiotics species and seeing what is affected. The other set of suggestions is obtained from the genomics of the bacteria that you have and the genomics of probiotic species. Two very different approaches which lead to the same probiotics.
Questions
This person is a new person to microbiome intrepretation (with a dose of brain fog)
Q: Are the items on the green add or increase lists the things I should be adding to my diet to help lower the levels of the bad bacteria I have.?
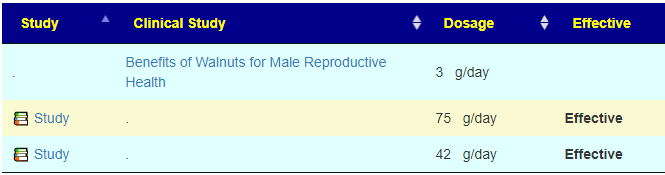
A: Correct, Some items have a ruler beside it, ?, This is a link to dosages used in clinical studies (i.e. likely both safe dosages, and likely sufficient dosage to cause change. They are slowly being added for more and more modifiers.
I have shown suggestions from BOTH of your samples below, you will note that they are very similar.
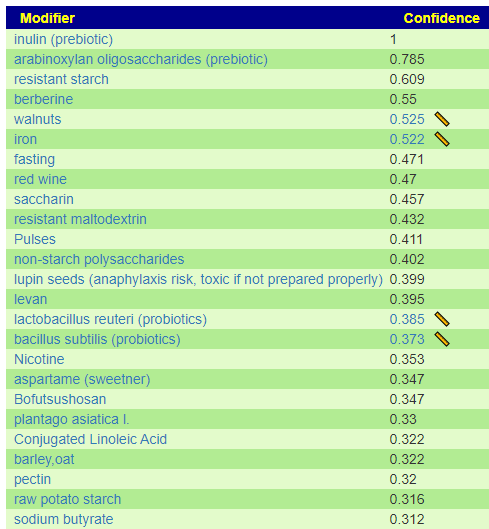
For example for walnuts we see that 40-80 gram/day (1.5 to 4 ounce) or 1/3 – 2/3 cups/day.
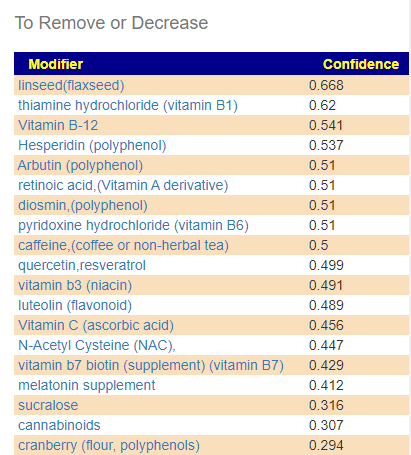
A: The Red ones are ones to reduce or eliminate from your diet when possible. These are substance that encourages the bad shifts. Often there can be surprises when the items to avoid are those often suggested. Best example is Vitamin B12 — I have a hypothesis (which some people agree with from their experience) that there are greedy bacteria in the gut that thrives on B-12 (thus accounting for low B-12 levels in the blood). It is suggested that B-Vitamins be taken by injection or transdermal (via skin patches).
Q: What should be the priorities in terms of diet and supplements to help reduce the levels of bad bacteria?
A: After reducing as many red items slowly (don’t go cold turkey!) as practical, start adding the green items with the highest confidence items according to practically (cost, ease of preparation, other issues). Again, small steps, adding one every two days. For probiotics, do one for two weeks and then change to a different one (See this post for background)
Q: Also the top three probiotics that the AI program came up with are Symbiopharm/ symbioflo, Regactiv immune and vitality and LGasseri probiotic. Is that correct? I have started taking Visbiome?
A: Yes, Visbiome has mixed benefits, some of it’s component may shift items in the wrong way. It’s estimated confidence is 11 versus another mixed item Global Healing Center / FloraTrex with a value of 95. I would suggest taking it for two weeks (or until one of the other arrives, which ever occurs last).
Q: Also I see that Enterobacter, Bacteroides, Firmicites and Bacillus are too high. Which of these is the biggest problem and what particular bacteria in these bacteria families are over grown?
A: Unfortunately, there is no way to detects which is the biggest problem. People will often speculate. With specials studies, we get a measure of how strongly bacteria are associated (called a z-score), For you, the most statistically significant for Long Covid that you have are
- Catonella
- Catonella morbi
- much lower: Clostridia
For Chronic Fatigue Syndrome the top ones for significance that you have are:
- Sporolactobacillus
- Sporolactobacillus putidus
- Prevotella copri
- Shuttleworthia
Q: I see from watching your other videos that I fit the pattern of a CFS patients pattern with a high number of rare bacteria. Have you seen people being able to reverse this to a more healthy normal microbiome and recover?
A: Yes, take a look at this recent review A History of Several 16s Tests and Suggestions where we see measurable objective improvement as well as the person reporting improvement of some symptoms. There are several people that are doing test-> suggestions –> retest repeat. They have been forwarding their new samples to do an update as they are done (usually 3 months between tests). The pattern has been improvement both subjectively and objectively — unfortunately, it is not an overnight recovery, rather a slow methodological journey.
Different combination of bacteria cause different symptoms so the progress is from waypoint to waypoint .
1 thought on “GI Map vs Biomesight for Long Covid after ME/CFS”
Comments are closed.