Update on Association Detection with the Microbiome

The nature of data for the microbiome is not a straight line, nor a bell curve. Finding associations is challenging with often poor results I know from years working as a statistician that finding a “magical data transformation” is the key to finding associations. However, a ongoing issue is over-fitting the data when people try formula at random. I have tried a variety of methods from machine learning — with poor results in general.

I put my lateral thinking cap on. Instead of using a defined explicit formula — instead an intrinsic transformation: the percentile of the readings. To do this approach, you need a large sample size – fortunately I have such with over 1500 pairs of data points being common. A similar approach was discussed in Percentile Regression: A Parametric Approach 1978, Journal of the American Statistical Association, but never gained popularity.

This post gives a walk thru of the process being done on 14,374,869 possible associations that we have (excluding symptoms and conditions)

Example

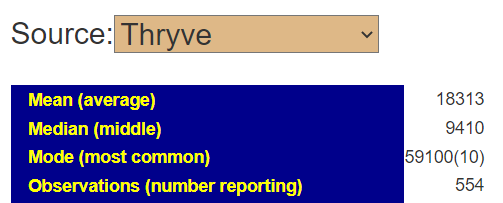
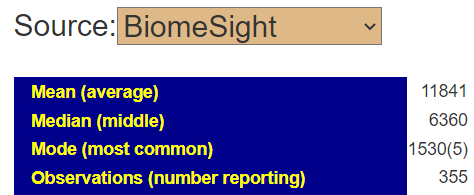
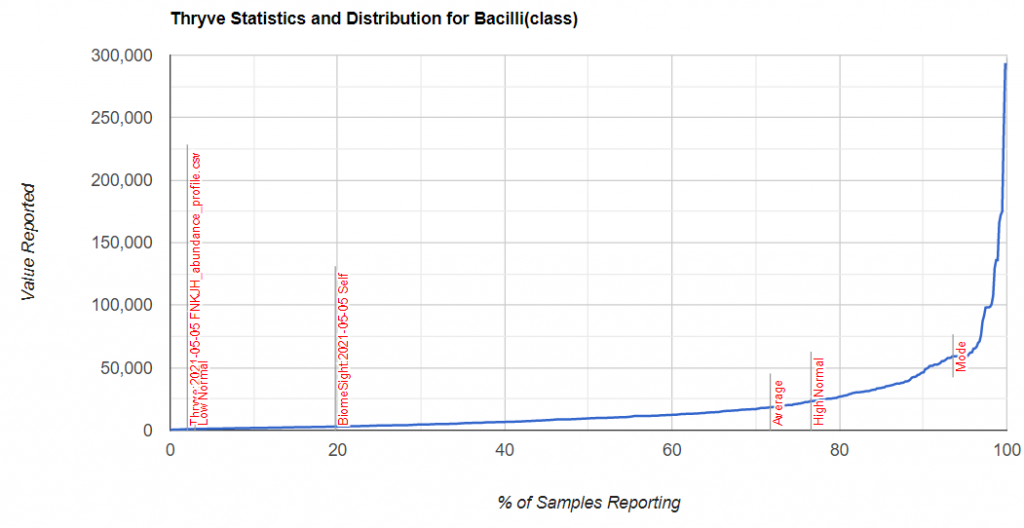
I picked one of my initial good results and will walk thru charts showing how charts change according to the approach. First the raw numbers plotted

We see a relationship which looks weak (flat) if you do not do the R2 calculations

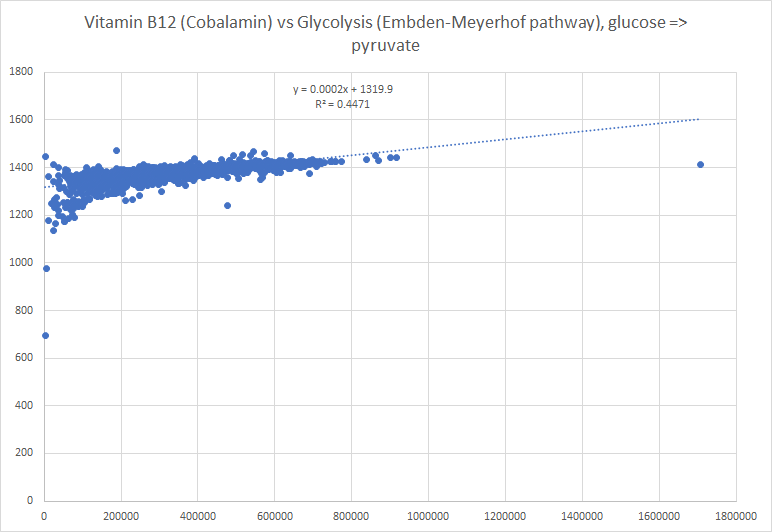
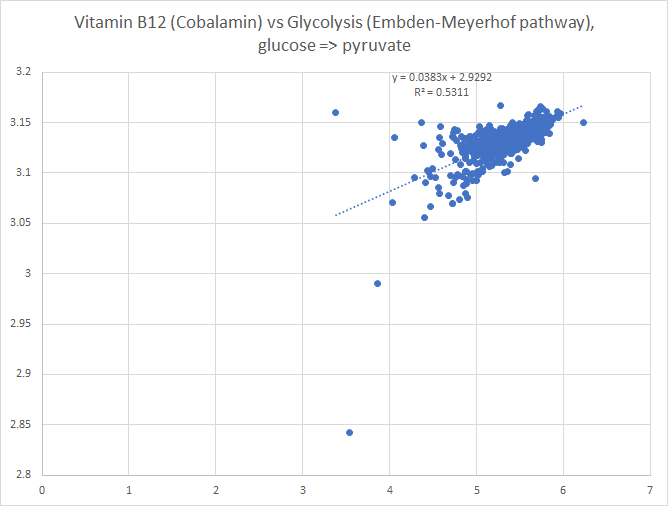
Then we chart of log of the raw numbers (log of the values worked well to determine the Kaltoft-Moldrup normal ranges – KM is based on different moments of the resulting curves)

The pattern is stronger (20% higher R2)

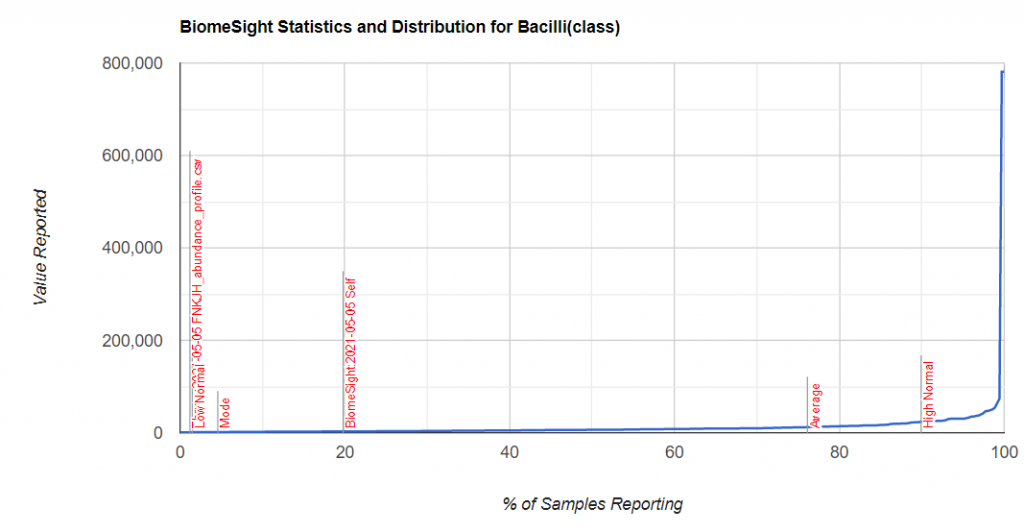
The new way is shown below, using the intrinsic transformation to percentile
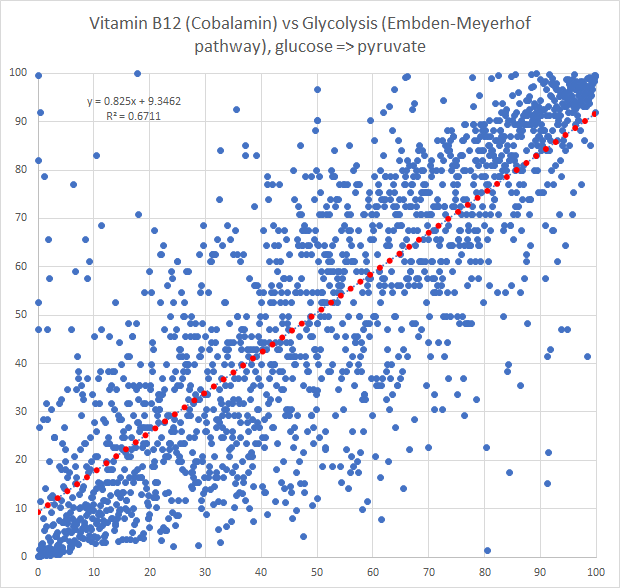
Plotting Percentile against Percentile (52% higher R2 than original)

Bottom Line

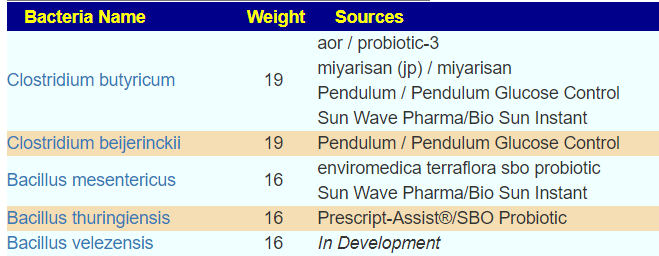
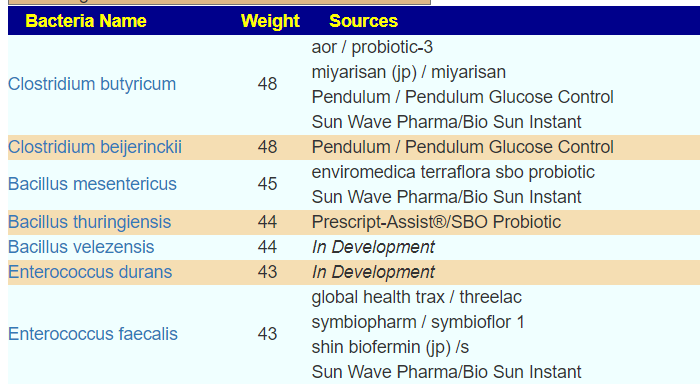
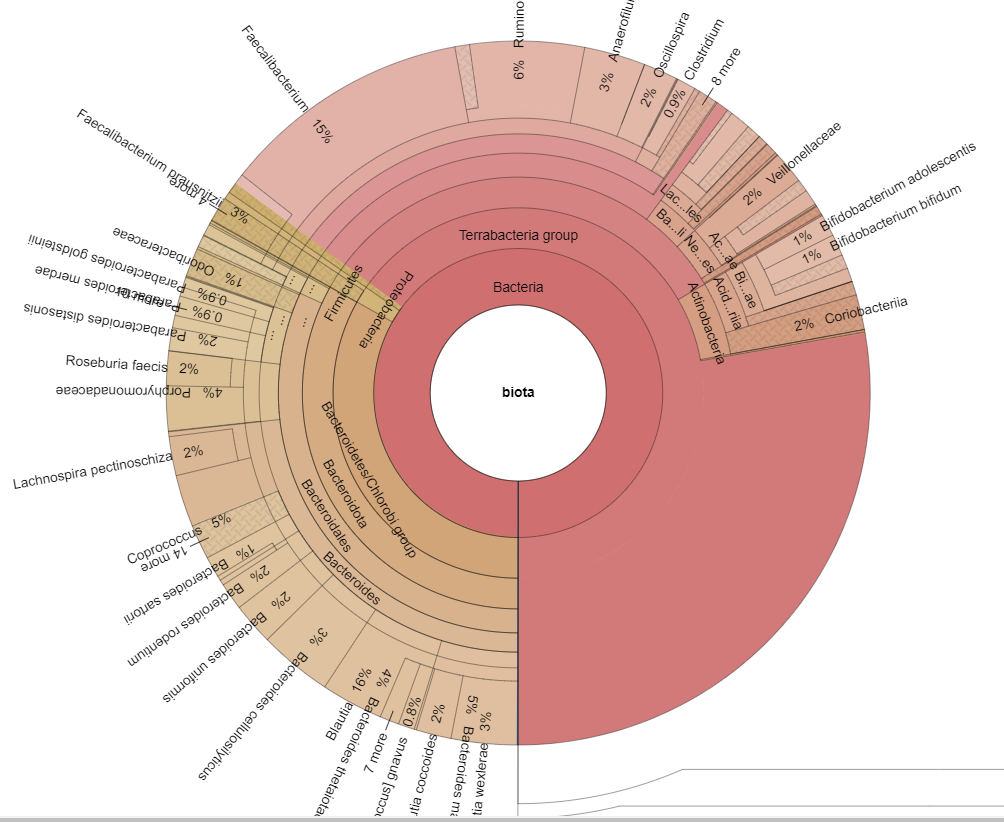
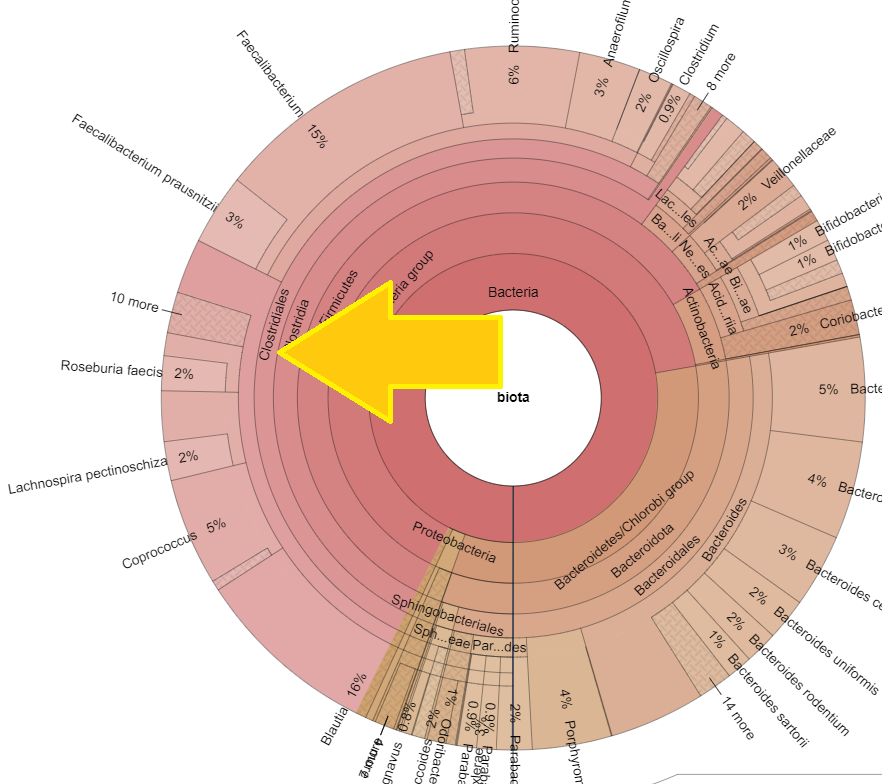
Finding associations as illustrated above, means we can tease information from our data. For example, for B12 levels, we have a strong association to Glycolysis (Embden-Meyerhof pathway), glucose => pyruvate. This means that the bacteria associated with that is likely associated with B12 production. For example, a few of some 2000+ strains associated with this module.

  • Faecalibacterium prausnitzii
  • Bacteroides vulgatus
  • Bacteroides uniformis
  • Parabacteroides distasonis
  • Bacteroides caccae
  • Bacteroides dorei
  • Bacteroides thetaiotaomicron
  • Bacteroides ovatus
  • Roseburia intestinalis
  • Flavonifractor plautii
  • Bacteroides fragilis
  • Odoribacter splanchnicus
  • Alistipes finegoldii
  • Eggerthella lenta

Additionally, it means that where there is a relationship between bacteria but we know nothing about how to modify one of the bacteria and something about the other; then we can propose suggestions by association. This will be coming soon to Microbiome Prescription – the citizen science site.

Microbiota dysbiosis and circadian disturbances

Hey do you think microbiota dysbiosis could cause circadian disturbance? Most articles go in an opposite direction and say its lifestyle causing circadian disturbance…But my disturbance is resistant to lifestyle… I just have primary circadian problem that might be even my worst symptom… Most resistant and almost lifelong. 

Asked by a Reader

In keeping to “gold standard” of information instead of bloggers’ urban myths and ideologies, I head over to the National Library of Medicine studies.

  • “gut microbial metabolites influence central and hepatic clock gene expression and sleep duration in the host and regulate body composition through circadian transcription factors”[2020]
  • “Findings have suggested that gut microbiota play a major role in regulating brain functions through the gut-brain axis. A unique bidirectional communication between gut microbiota and maintenance of brain health could play a pivotal role in regulating incidences of neurodegenerative diseases. ” [2021]

Sleep, circadian rhythm, and gut microbiota [2020]

First, a more precise definition of circadian rhythms from the above study.

A fundamental part of eukaryotic life, circadian rhythms are endogenous, entrainable biological processes that oscillate in a 24-hour period in concert with the circadian environment of the earth. Circadian rhythms can be found at an intracellular level and have the ability to impact all aspects of metabolism (11). The mammalian circadian rhythm is orchestrated by a master clock, located in the suprachiasmatic nucleus (SCN) of the hypothalamus (12). The master clock follows the 24-hour light-dark cycle (the diurnal cycle) and coordinates the release of neurotransmitters such as serotonin and norepinephrine. Serotonin and norepinephrine are present at higher levels during wakefulness, while melatonin peaks during the night, regardless of the diurnal or nocturnal sleep cycles across species… The peripheral circadian clock is a system of organs within the 22 body which collect
environmental and internal signals in order to direct the expression of circadian clock genes

And then we read:

  • “food intake can disassociate peripheral clock periodicity from the master clock; when this happens, greater immune system activation and metabolic dysfunction occur”
  • “Dysbiosis and metabolic consequences resulting from circadian clock disruption may be due to increased permeability of the intestinal epithelial barrier “
  • “gut microbial metabolites such as the short-chain fatty acids butyrate and acetate may influence clock gene expression
  • “Leone et al. found that a lack of gut microbiota, and consequently a deficit of microbial metabolites, resulted in markedly impaired central and hepatic circadian clock gene expression (40), suggesting the possibility that gut microbiota play a role in propagating circadian rhythm at the molecular level”
  • “Serotonin deficiency elicits the loss of the circadian sleep-wake rhythm”
  • “The microbes of the gastrointestinal tract exhibit circadian rhythm, and their composition oscillates in response to the daily feeding/fasting schedule.

The Role of Microbiome in Insomnia, Circadian Disturbance and Depression [2018]

The characteristics of the gastrointestinal microbiome and metabolism are related to the host’s sleep and circadian rhythm. Moreover, emotion and physiological stress can also affect the composition of the gut microorganisms. The gut microbiome and inflammation may be linked to sleep loss, circadian misalignment, affective disorders, and metabolic disease. 

Circadian misalignment and the gut microbiome. A bidirectional relationship triggering inflammation and metabolic disorders”- a literature review [2020]

On the other hand, peripheral clocks are found in the nucleus of almost every single cell (eg, enterocyte, hepatocyte, myocyte, adipocyte), and they show circadian rhythms and oscillations that are dependent and independent of the circadian rhythms from the master clock. While the master clock responds mainly to light/dark cycle, peripheral clocks respond to other zeitgebers (eg, temperature, diet, timing, and content of food intake), which indirectly regulate the central clock …
However, Parabacteroides, Lachnospira, and Bulleida were specific to the human GI tract. Lachnospira was unique in that it was the dominant species that were affected by time and behavior (energy consumption early during the day) [114]. However, it is not fully understood why some species increase with clock time throughout the day. One of the theories is that some species are bile resistant, so they increase during the day as the food is ingested, and bile is secreted (eg, Oscillospira and )

A day in the life of the meta-organism: diurnal rhythms of the intestinal microbiome and its host [2015]

“We found that up to 20% of all commensal species in mice and humans undergo diurnal fluctuations in their relative abundance, resulting in rhythmic changes of the entire bacterial community over the period of one day.  For instance, the common mouse and human commensal genus Lactobacillus increases in relative abundance during the resting phase (the light phase in a mouse) and declines during the active phase.”

Bottom Line

Time of day, time of year, eating time and diet impacts intra-day microbiome population and thus the metabolites being produced. Some of these metabolites have been shown to impact circadian cycle in recent studies. A few bacteria pulled from the studies cited above include:

  • Fusobacterium
  • Porphyromonas,
  • Prevotella
  • Bacteroides acidifaciens,
  • Lactobacillus reuteri,
  • Peptococcaceae
  • Eggerthella,
  • Anaerotruncus,
  • Desulfovibrio,
  • Roseburia,
  • Ruminococcus

Time of year impacts (and may be a factor for Seasonal Affective Disorder – SAD)

  • Helicobacter,
  • Bacillus,
  • Stenotrophomonas
  • Proteobacteria,
  • Lactobacillus
  • Romboutsia

I was unable to find any 16s clinical studies on SAD

Advice for taking samples

Record the day of the week, time of day, and if female, where you are in your cycle for stool samples. For best consistency (i.e. seeing what actually changed between samples) — make sure all follow up control for these factors as much as possible.

Same Raw Data via Thryve and Biomesight

By same data, I mean the same FASTQ files, a detail file of the parts of your sample returned by a 16s machine. This is then processed through software to infer the bacteria. The result is two different reports. If you pass the same files to other providers, you will like get even more different reports. For why, see this post from 2019, The taxonomy nightmare before Christmas

This post is going to look an actual example.

What a FASTQ file looks like… the letters CGAT mean adenine (A), cytosine (C), guanine (G), and thymine (T) – parts of DNA

Krona View

At this level, they look similar – but there is often a 25% difference between the numbers of a species.

Thryve
BiomeSight

Comparing Samples

At the class level you can see some dramatic changes in counts and percentile. At present, I am using percentiles from aggregations of all labs sources.

When I hit 1000 samples from a specific lab, I will doing lab specific percentiles. Current counts — thus we are using an aggregate for percentile for all labs

From https://microbiomeprescription.com/Upload/Statistics

For items of concern, you can actually drill down manually on the bacteria. For example for Bacilli above.

You can also get the percentile that is lab specific by going to https://microbiomeprescription.com/Library/Statistics?taxon=91061 with no sample and then changing to the lab as shown below.

https://microbiomeprescription.com/Library/Statistics?taxon=91061&source=Thryve
https://microbiomeprescription.com/Library/Statistics?taxon=91061&source=BiomeSight

We find that we are at the 20%ile for biomesight specific samples and 2.4%ile for thryve specific samples. For explanations, you will need to ask the questions to the lab — microbiome prescription just presents the data.

Kegg Probiotic Suggestions

Different input present different outputs.

From Thryve
From Biomesight

Dr. Jason Hawrelak Recommendations

One reports 9 items that are not ideal, and the other 8. There is disagreement on Blautia, Desulfovibrio, Lactobacillus, Roseburia and Bilophila wadsworthia

BiomeSight
Thryve

Bottom Line — FRUSTRATION!

The bottom line is that you want to always use the same lab software for comparing samples. Ideally, the same lab for the physical processing. Comparing the same sample that is processed by two different pieces of software results interpretation challenges.

To give a more human context — take a book and ask two people to retell it aloud, one is from the rural areas of Scotland (with thick Scottish accent) and the other from Mumbai India (with thick Marathi accent) with a third person (a native from Bermuda) trying to recall what they heard…. Different choice of words in the retelling with different intonations. That is the human reality — which also applies to labs.

BiomeSight Issue and Consequences

There was a transcription error in a lookup table for biomesight ONLY, as a result

For most suggestions, this should have zero impact because the defaults do not include class or order numbers.

For End Products, the following would be incorrectly calculated.

  • Butyrate
  • Vitamin B12 (Cobalamin)

All of the KEGG data is based on Species and Strains – so no impact there.

Visual Representations would be off

Often a large blank area will appear
This missing section disappears with a fresh import

Remember “Data Drift” because our data is live

If you upload and get suggestions and then return in 4 months, you may get slightly different suggestions with the identical request. Why?

  • We based our detection of high and low from the examples uploaded. Lat month, 104 new samples were added. That’s a 6% growth/month.
  • We add more new studies every month – often dozens. This impacts our suggestions. At present we have 5500 studies that we extract information from.
  • Studies are increasing every month on 16s microbiome