” No consistent association between a vegan diet or vegetarian diet and microbiota composition compared to omnivores could be identified. Moreover, some studies revealed contradictory results. This result could be due to high microbial individuality, and/or differences in the applied approaches. Standardized methods with high taxonomical and functional resolutions are needed to clarify this issue. “
I have seen that also in extracting facts to the database. While diet (based on these studies) is still on the suggestions list, it is not recommended to use. Specific food is a very different question. Diets tend to be nebulous collections of foods making things very undefined.
I recall reading reviews of difference of reports by bloggers who took two samples from the same stool and sent them to different analysis labs. There are a dozen possible explanation for those differences.
Due to the demise of uBiome, a number of former users downloaded their FASTQ data files and processed that data through different providers that will determine the bacteria taxonomy from FastQ files. Most of us naively believed that the reports would be similar – after all it is digital data in and thus similar taxonomy would be delivered… It appears that things are a lot more complex than that.
A taxonomy download may be 20-30,000 bytes. This contains the bacteria name and hopefully the taxa number with the percentage or count out of a million. The FastQ file is the result of a machine reading the DNA bits of bacteria in your microbiome. It is a lot bigger. DNA bits are represented by 4 characters (A,T,C,G) The typical data would be 170,000,000 bytes (170 Megs).
If you examine the text, yes text, you will see line after line with:
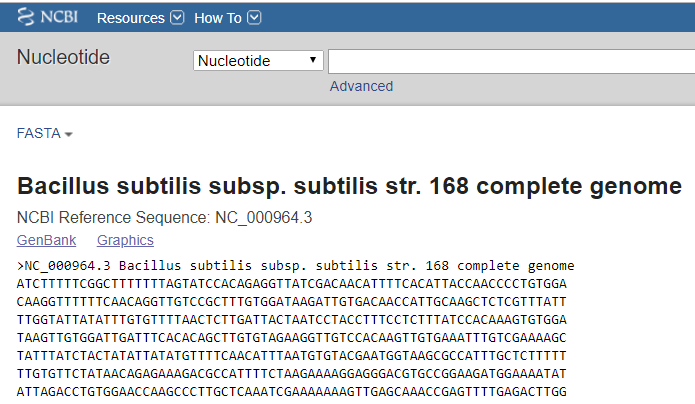
These strings have been matched to certain bacteria, just like your DNA would match to you (and other people closely related). If you go over the US National Library of Medicine, you will find information on these sequences, like this for Bacillus subtilis , a common probiotic.
So, the process is matching up to a reference set. At this point of time we walk into the time trap!
A firm like uBiome may have gotten the latest values when it was started. I suspect a business decision was made not to constantly update them. Why you ask? The answer is simple, to maintain consistency and comparability from sample to sample over time. If they use newer ones, then they should reprocess the old ones to be consistent, but then reports will change in minor or major ways — resulting in support emails and phone calls. Support can be a major expense. So keep to what we started with. I suspected that with uBiome Plus, they were working on using new reference values, after all it was a different test!!
Each provider has a different set of reference sequences. Their sequences may be proprietary (not in the publish site above). This means that to compare results, you need to use the same reference sequences to match with your FastQ microbiome data. If not, it may result in a “bible” by taking page 1 from King James Bible, page 2 from the Vulgate, page 3 from Tynsdale’s translation, etc. Things become a hash.
Another issue also arises, bacteria get renamed or refined. The names used in an older reference library may not match the names in a latter reference library.
For myself, I have the FastQ for all of my uBiome tests and my Thryve Inside tests. I will continue on requiring these FastQ files from testing firms so I can keep the ability to compare samples to each other overtime by running them through the same provider.
I have created a page to allow comparison between FastQ files processed to taxonomy by different provider. The button to get to it, is at the top of the Samples Page – “FastQ Results Comparison”
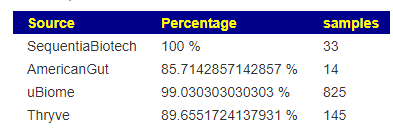
This takes you to a list of all of your samples. Note that I have 4 samples with the same date below. It is actually just 1 FastQ file interpreted by four different providers. There are additional providers.
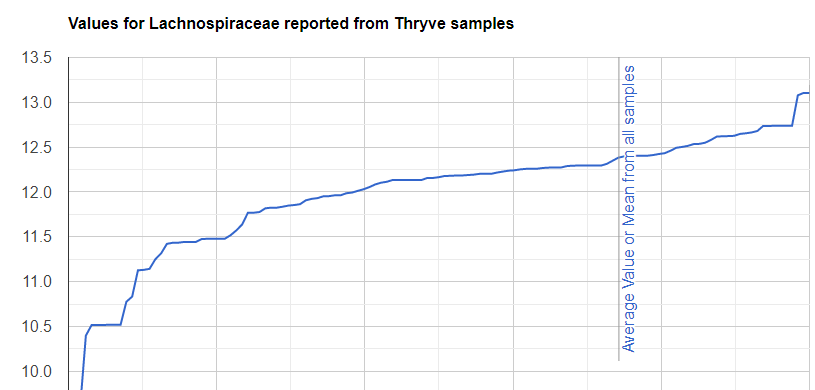
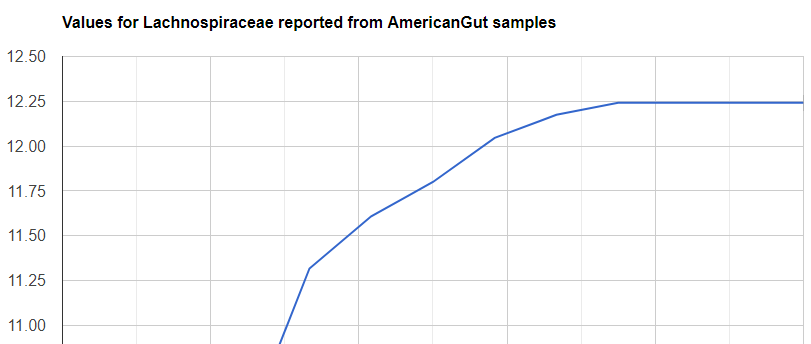
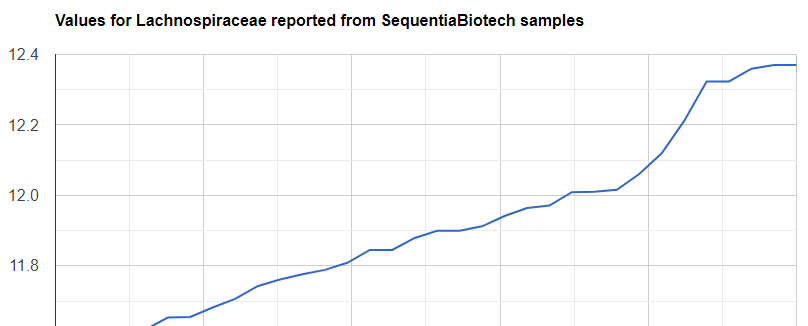
This produces a report showing the normalize count (scaled to be per million). I also have the raw count on the page as tool tips over each numbers.
Who has the right numbers?
Without full disclosure by all of the providers, it is difficult to tell.
With all things equal, the current provider that you are getting samples processed through would be the first choice. Why? it allows you to do immediate comparisons. This is not that critical because both https://www.biomesight.com/and https://metagenomics.sequentiabiotech.com/ will convert a FastQ file to a taxonomy in less than a hour.
What about Research Findings?
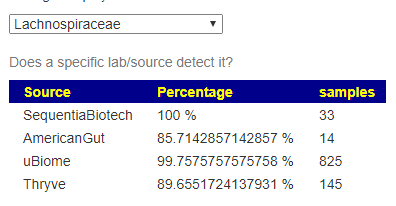
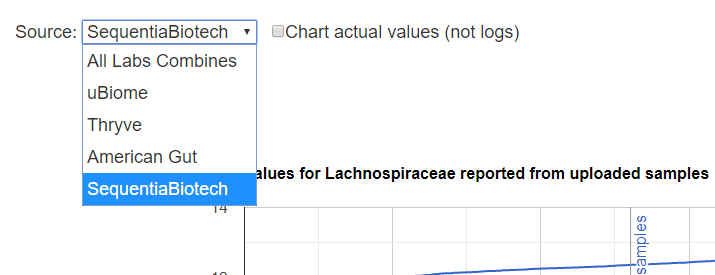
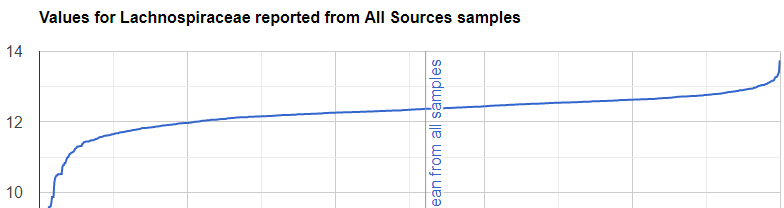
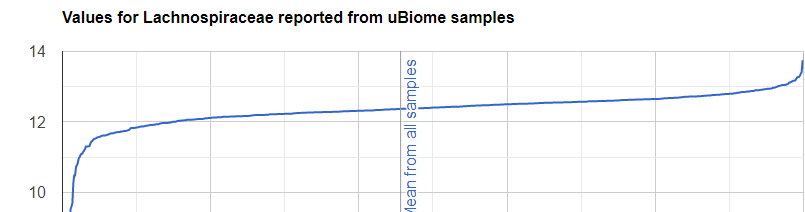
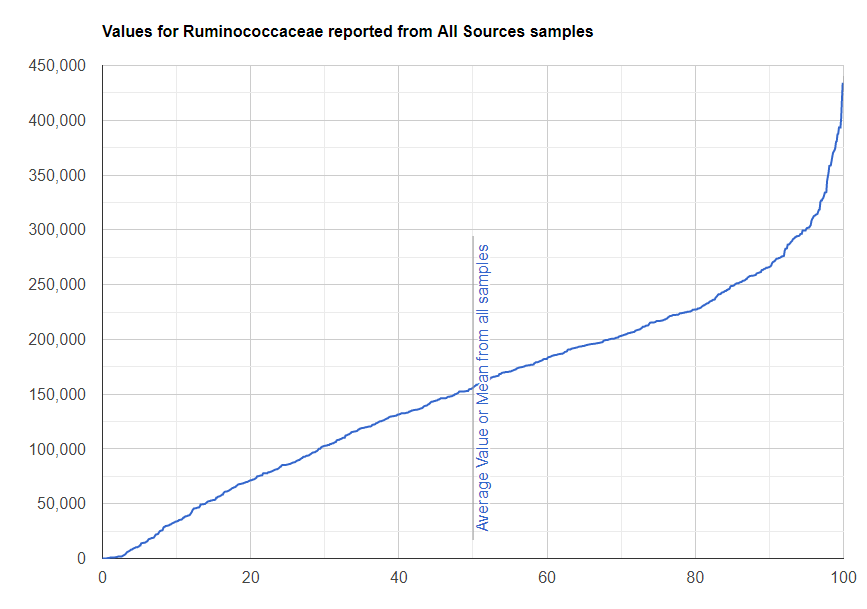
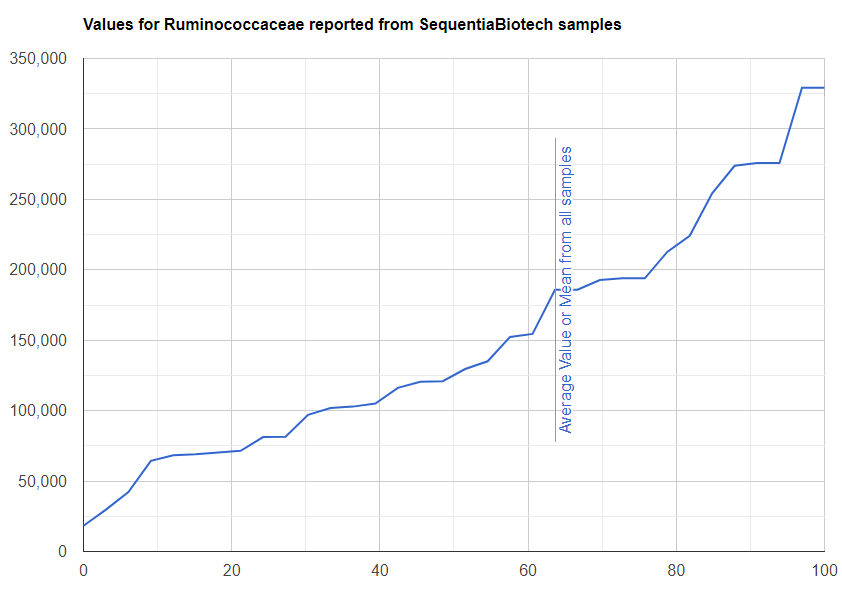
Fortunately, researchers use the same process for each study. That means that the results are relatively independent of the process used. It does mean that Study A may find some bacteria are high or low and this is NOT reported in Study B. The why may be very simple, that bacteria was never looked for. Things get fuzzy. With the distribution of bacteria known for a particular method, then we can determine if it is high or low… but that means sufficient samples with that method. With uBiome, we had a large number of samples from this one provider and that allow us to make some good citizen science progress.
Bottom Line on why the difference
Different reference libraries
Change in bacteria classifications (same sequence, different name)
I recall reading reviews of difference of reports by bloggers who took two samples from the same stool and sent them to different analysis labs. There are a dozen possible explanation for those differences.
Due to the demise of uBiome, a number of former users downloaded their FASTQ data files and processed that data through different providers that will determine the bacteria taxonomy from FastQ files. Most of us naively believed that the reports would be similar – after all it is digital data in and thus similar taxonomy would be delivered… It appears that things are a lot more complex than that.
A taxonomy download may be 20-30,000 bytes. This contains the bacteria name and hopefully the taxa number with the percentage or count out of a million. The FastQ file is the result of a machine reading the DNA bits of bacteria in your microbiome. It is a lot bigger. DNA bits are represented by 4 characters (A,T,C,G) The typical data would be 170,000,000 bytes (170 Megs).
If you examine the text, yes text, you will see line after line with:
These strings have been matched to certain bacteria, just like your DNA would match to you (and other people closely related). If you go over the US National Library of Medicine, you will find information on these sequences, like this for Bacillus subtilis , a common probiotic.
So, the process is matching up to a reference set. At this point of time we walk into the time trap!
A firm like uBiome may have gotten the latest values when it was started. I suspect a business decision was made not to constantly update them. Why you ask? The answer is simple, to maintain consistency and comparability from sample to sample over time. If they use newer ones, then they should reprocess the old ones to be consistent, but then reports will change in minor or major ways — resulting in support emails and phone calls. Support can be a major expense. So keep to what we started with. I suspected that with uBiome Plus, they were working on using new reference values, after all it was a different test!!
Each provider has a different set of reference sequences. Their sequences may be proprietary (not in the publish site above). This means that to compare results, you need to use the same reference sequences to match with your FastQ microbiome data. If not, it may result in a “bible” by taking page 1 from King James Bible, page 2 from the Vulgate, page 3 from Tynsdale’s translation, etc. Things become a hash.
Another issue also arises, bacteria get renamed or refined. The names used in an older reference library may not match the names in a latter reference library.
For myself, I have the FastQ for all of my uBiome tests and my Thryve Inside tests. I will continue on requiring these FastQ files from testing firms so I can keep the ability to compare samples to each other overtime by running them through the same provider.
I have created a page to allow comparison between FastQ files processed to taxonomy by different provider. The button to get to it, is at the top of the Samples Page – “FastQ Results Comparison”
This takes you to a list of all of your samples. Note that I have 4 samples with the same date below. It is actually just 1 FastQ file interpreted by four different providers. There are additional providers.
This produces a report showing the normalize count (scaled to be per million). I also have the raw count on the page as tool tips over each numbers.
Who has the right numbers?
Without full disclosure by all of the providers, it is difficult to tell.
With all things equal, the current provider that you are getting samples processed through would be the first choice. Why? it allows you to do immediate comparisons. This is not that critical because both https://www.biomesight.com/and https://metagenomics.sequentiabiotech.com/ will convert a FastQ file to a taxonomy in less than a hour.
What about Research Findings?
Fortunately, researchers use the same process for each study. That means that the results are relatively independent of the process used. It does mean that Study A may find some bacteria are high or low and this is NOT reported in Study B. The why may be very simple, that bacteria was never looked for. Things get fuzzy. With the distribution of bacteria known for a particular method, then we can determine if it is high or low… but that means sufficient samples with that method. With uBiome, we had a large number of samples from this one provider and that allow us to make some good citizen science progress.
Bottom Line on why the difference
Different reference libraries
Change in bacteria classifications (same sequence, different name)
Recent Comments