Before you get upset, it is many and not all. The count of bacteria is good — the issue is with the ranges they suggest is healthy or not is bad — as in misleading and not supported by statistics. There is a saying “Lies, damned lies, and statistics” – as a professional statistician, former member of American Statistical Association with a M.Sc. and many Ph.D. courses, I agrees — especially when the speaker of statistics is not a professional in statistics( additionally without political/business influence and free to give all of the qualifications for the statistics — usually 40-60 pages!). Statistics are simplified into convenient lies.
I have write about this in a prior post.
Reader’s Message
Hey Ken,
Message May 23rd, 2021
I’d just like to clarify with you something. I’m comparing some results on specific bacteria using your Taxon Hierarchy View with the advanced results section on my Biomesight sample. And see some differences in the “percentile” and optimal ranges. If you could take a look and clarify the differences that would be great, as It seems your site shows I have an overgrowth (91%ile) and on Biomesight scale its on the low end. I’ll attach some screenshots


So other labs do not feel left out…
ThryveInside

Microba
- “Blautia” genus: 024% to 2.92%
Xenogene
They give ranges only by species, for each species the range is 1-6%. and give 4 species thus for the genus: 4% to 24% would be implied.

Medical literature has no clear ranges that can be reduce single numbers.
- Blautia genus associated with visceral fat accumulation in adults 20–76 years of age [2019]
- “Men/Women with higher VFA harboured a smaller relative abundance of Blautia” (See Table 2 for details)
- Above 10% is very healthy
- Below 3% is unhealthy
- “Men/Women with higher VFA harboured a smaller relative abundance of Blautia” (See Table 2 for details)
- Gut microbiome diversity influenced more by the Westernized dietary regime than the body mass index as assessed using effect size statistic [2017]
- Some overweight people had 20%
Microbiome Prescription Method
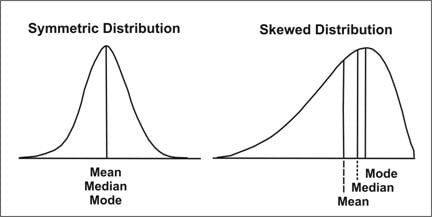
Sorry folks, it is not a bell curve. Median Mean and Mode should be the same values.

An Introduction to Applied Epidemiology and Biostatistics
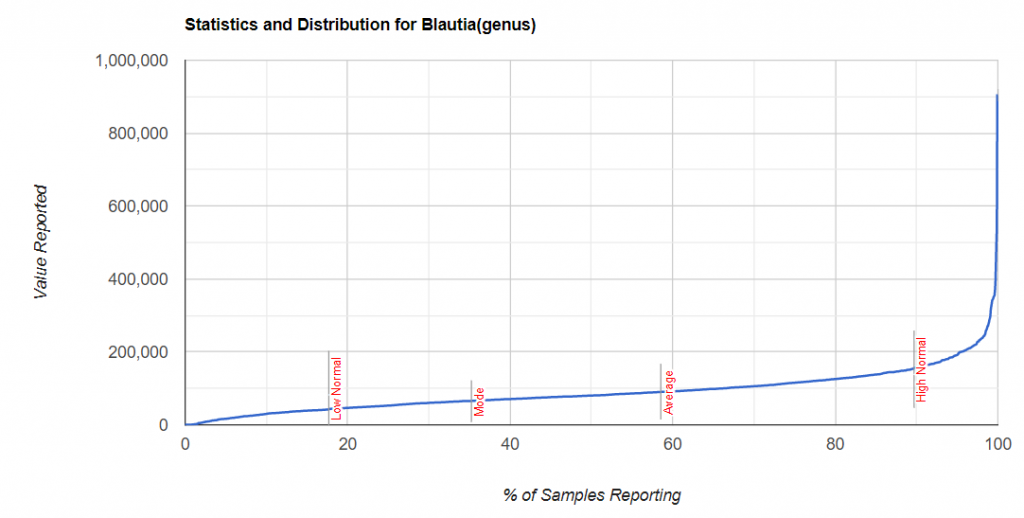
We use the actual distribution of samples (which every lab has access to in their database, but no one seems to expose!!). You can see the distribution for Blautia here.
- Mean (average) 90167 or 9%
- Median (middle)80399 or 8%
- Mode (most common)65340 or 6.5%

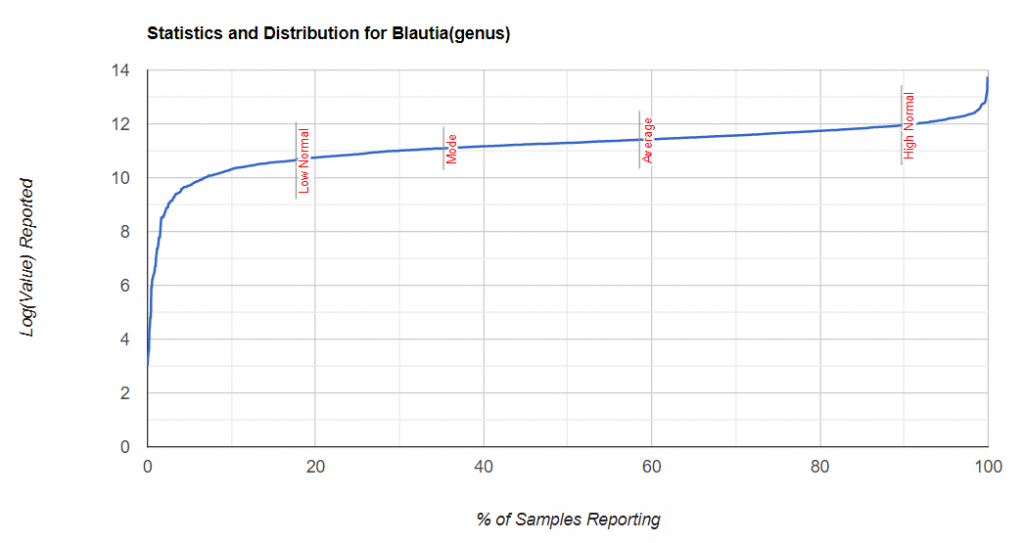
To determine when numbers appear to become abnormal, we look at the log of the values — which usually produces a flat line with upticks or downticks at either end. The question is where does this curve get extreme enough to warrant concern? We use the Kaltoft-Møldrup algorithm which examines the 2nd and higher orders of the curve. This detects atypical values in the population – this may or may not be healthy. It is just atypical.

In the above case, we have:
- Normal Range Bottom: 42244 or 4.2%
- Normal Range Top: 153693 or 15.3%
How do we compare?
- Our low boundary 4.2% may be:
- higher than ThryveInside (not by much) of 4%
- lower than Q1 of Biomessight of 6.3% (my 25%ile is 5.3%)
- higher than Microba (0.29%)
- Our high boundary 15.3 may be:
- higher than ThryveInside 8%
- higher than BiomeSight 12.4% (my 75%ile is 11.6%)
- higher than Microba (2.92%)
Biomesight does not state these are healthy ranges, they just what Q1 (25%ile) and Q3(75%ile) are. People may infer that is the healthy range — but BiomeSight does not state it. ThryveInside makes a health-style statement.
Bottom Line
We have four “statements”
- BiomeSight states the Q1 and Q3 – does not explicitly state healthy or unhealthy. They use a standard statistical display of the data – unfortunately for the common person to interpret this may be a challenge.
- ThryveInside does not show the ranges of values, but make an explicit health evaluation
- MicrobiomeDescription — determines ranges and uses the phrase “atypical” and outside of normal.
- Microba – gives a “Reference Range”
These issues can be addressed by the 16s labs exposing their actual distributions of samples (ideally with ability to filter, i.e. blautia distribution for vegetarians, blautia distribution for 60-70 year old). The following are know to greatly influence the microbiome (and thus what is normal)
- Age
- Gender
- Diet
- Urban or Rural
Personally, I favor (of course), what happens on Microbiome Prescription — showing the distribution curves (for the data nerds) as well as providing a typical reference range that is NOT BASED ON A BELL CURVE ASSUMPTION.
16s Lab Folks, hire good experienced statisticians!!! I know that you will likely have to pay them more than the CEO because with AI being very hot and very short of experienced people, their salary demands will be high because these same folks are being head-hunted by Amazon, Microsoft and Google!
Recent Comments