Artificial Intelligence Models for Microbiome Analysis

For a number of years, I taught a 3rd year Artificial Intelligence survey course for Chapman University. Career wise while my “bread and butter” came from software engineering, I have in that profession often done data science, statistics and artificial intelligence for various employers.

Looking at AI systems for the microbiome back in 2015, I went with a model that I had used professionally: Expert System with Fuzzy Logic. An expert system use logic. The term fuzzy logic means that probability is used at decision points.

History Lesson

The first significant use of an expert system in medicine was the development and application of MYCIN in the early 1970s at Stanford University. MYCIN was designed to diagnose bacterial infections, particularly blood diseases, and to recommend appropriate antibiotics, taking into account factors such as patient weight and the specific infection identified. The system was based on a set of about 500 cause-and-effect rules and could explain its reasoning, as well as suggest additional laboratory tests if necessary.

MYCIN demonstrated the potential of artificial intelligence to support clinical decision-making, often matching or even exceeding the diagnostic accuracy of human specialists—achieving around 70% accuracy in controlled tests. Despite its success, MYCIN was never implemented in routine clinical practice, largely due to legal and accountability concerns regarding the use of AI in critical medical decisions.

Other expert systems were developed around the same time, but MYCIN is widely recognized as the first major, influential expert system specifically designed for medical diagnosis and treatment, marking a pivotal milestone in the history of AI in healthcare.

(Doctor) Watson Healthcare Application

IBM Watson’s entry into healthcare began in earnest around 2011, when IBM started developing healthcare-specific applications leveraging Watson’s natural language processing and machine learning capabilities. The system was designed to analyze large volumes of medical data—including electronic health records, medical literature, and clinical guidelines—to assist physicians in making more informed treatment decisions, especially in complex cases like cancer.

Key milestones and applications include:

  • 2013: Watson’s first commercial healthcare application was for utilization management decisions in lung cancer treatment at Memorial Sloan-Kettering Cancer Center. This marked the beginning of Watson’s deployment in real-world clinical settings.
  • 2016: IBM launched “Watson for Oncology,” a product designed to provide personalized, evidence-based cancer care options to physicians and patients.

Watson was positioned as a tool to bridge knowledge gaps, keep clinicians updated on the latest evidence, and support personalized care by tailoring recommendations to individual patient profiles. However, the initiative faced significant challenges, including high costs, privacy concerns, regulatory hurdles, and mixed adoption by healthcare providers. Notably, the partnership with MD Anderson Cancer Center was discontinued after substantial investment, and Watson for Oncology faced criticism for inconsistent recommendations and limited adaptability to local clinical practices.

Large Language Models

The first significant large language model (LLM) is generally considered to be GPT-1, released by OpenAI in 2018. GPT-1 was relatively small by today’s standards, with only 117 million parameters.

The release of GPT-2 in 2019 (with 1.5 billion parameters), and especially GPT-3 in 2020 (with 175 billion parameters), brought LLMs to much greater prominence and capability. These models, especially GPT-3 and later, are what most consider the foundation for today’s advanced LLM technologies.

Large language models (LLMs) present several well-documented problems and limitations when applied to medicine:

  • Hallucinations and Incorrect Information: LLMs can generate plausible-sounding but incorrect or fabricated medical advice, a phenomenon known as “hallucination.” This poses serious risks, especially when users do not verify outputs or lack medical expertise.
  • Lack of Medical Domain Optimization: General-purpose LLMs are often not fine-tuned with sufficient medical data, leading to misinterpretations of clinical terminology and context-specific nuances.
  • Transparency and Interpretability: The reasoning behind LLM outputs is often opaque (“black box” nature), making it difficult for clinicians and patients to understand or trust the basis for recommendations.
  • Algorithmic and Data Bias: Biases in training data or model design can result in unfair or inaccurate recommendations, especially for underrepresented patient groups.
  • Automation Bias and Overreliance: Clinicians may become overly reliant on LLM outputs, leading to uncritical acceptance and reduced independent judgment, a phenomenon known as automation bias.
  • Limited Regulatory Oversight: There is a lack of clear legal and ethical guidelines governing the use of LLMs in clinical settings, raising concerns about accountability and patient consent.
  • Information Completeness and Consistency: LLMs may provide incomplete or inconsistent answers, particularly when faced with complex or rare medical scenarios.
  • Privacy and Data Security: The use of sensitive patient data to train or fine-tune LLMs raises concerns about privacy, data security, and compliance with regulations like HIPAA.
  • Inequity of Access: Differences in technology access and digital literacy can exacerbate healthcare disparities, limiting the benefits of LLMs for certain populations.

Bottom line: Large Large Models are very questionable for use with the microbiome; while convenient, cheap and heavily hyped – there are so many issues that I view it has having huge legal liability risk dealing with the microbiome in a clinical setting.

Going Forward

A long time Ph.D. friend that attended multiple National Institutes of Standards and Technology conferences with me shared a post with me below. He, like me, have worked in senior positions as Architect and Strategist for firms such as Intel, VMWare, RSA and DELL, while I did time at Microsoft, Amazon, Starbucks and Verizon.

I responded with doing 7 times more data with 1/22 of the memory using my expert system!!!
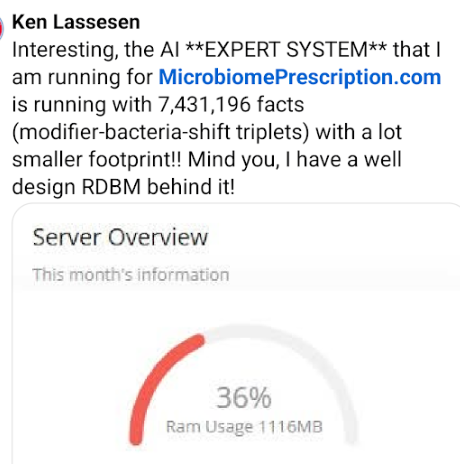
He added:
These LLM-ish technologies cannot approach the efficiency or trustability of an expert system or knowledge based system implementation, and LLMs fall apart under significant ambiguity.

LeCun ( world models (e.g. V-Jepa)), Pearl (Causal Models) and a few others are pointing the way to LLM alternatives (not an extension of LLMs).

The next step is at the intersection of Knowledge Representation and Reinforcement Learning , giving us a place to hang prior knowledge, ground truth, dependencies and real logics ( reasoning as opposed to chain of thought).

For those not familiar with these concepts and naively believe that AI is only Large-Language-Models.

Alternative AI Models

Yann LeCun

Yann LeCun is a Turing Award-winning computer scientist, Meta’s Chief AI Scientist, and a professor at New York University. He is best known for pioneering Convolutional Neural Networks (CNNs) in the late 1980s and early 1990s, which revolutionized computer vision and laid the foundation for modern deep learning systems. His work, especially LeNet-5, enabled breakthroughs in handwritten digit recognition and influenced countless AI applications, from facial recognition to autonomous driving.

LeCun is a vocal critic of the current generation of large language models (LLMs), arguing that they lack true reasoning, understanding of the physical world, persistent memory, and planning capabilities. He advocates for the development of world models—AI systems that can observe, interact with, and reason about the world, aiming for human-level intelligence.

V-JEPA (Joint Embedding Predictive Architecture)

JEPA (Joint Embedding Predictive Architecture) is a new paradigm in AI research championed by LeCun. Unlike traditional LLMs, which predict the next token in a sequence, JEPA aims to develop systems that can reason, plan, and interact with the physical world by learning from observation and experience.

JEPA’s core idea is to move beyond mere language processing, focusing instead on building AI architectures that can:

  • Understand and model the world (not just text or tokens)
  • Reason and plan based on learned representations
  • Maintain persistent memory for long-term understanding and context7

This approach is seen as a step toward more robust, general-purpose AI systems that could eventually surpass the limitations of current LLMs.

Judea Pearl (Causal Models)

Judea Pearl is a computer scientist and philosopher renowned for his foundational work on probabilistic and causal reasoning. He introduced the concepts of Bayesian networks and, most notably, the do-calculus for causal inference, which allows researchers to distinguish correlation from causation in complex systems.

Pearl’s causal models provide a mathematical framework for understanding how interventions (e.g., treatments in medicine) affect outcomes, enabling more accurate predictions and explanations in fields like epidemiology, economics, and machine learning. His work has had a profound impact on AI, particularly in areas where understanding cause-and-effect relationships is critical.

Hybrid AI Systems:

  • Combining symbolic AI (rule-based reasoning) with neural networks for more robust and interpretable A

Basic Criteria to evaluate an AI Model

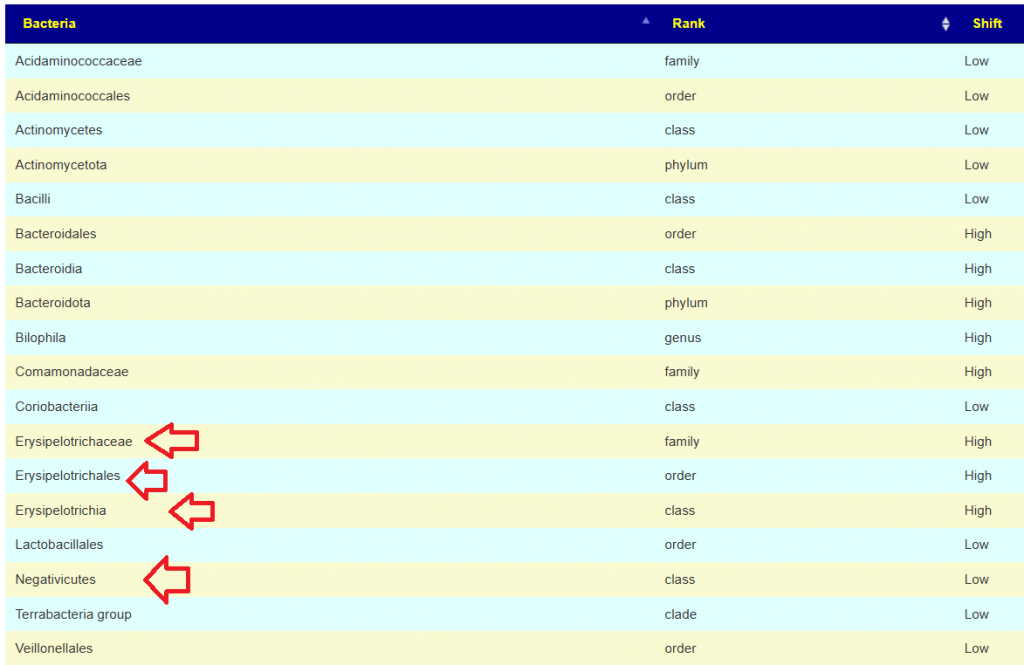
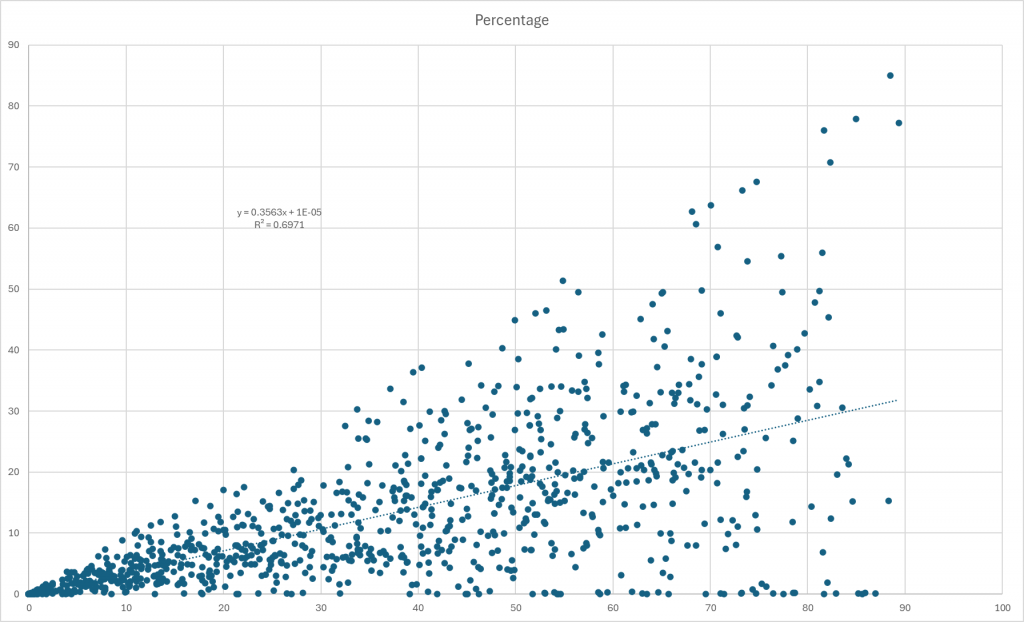
Ability to Accurately forecast symptoms and conditions from a sample

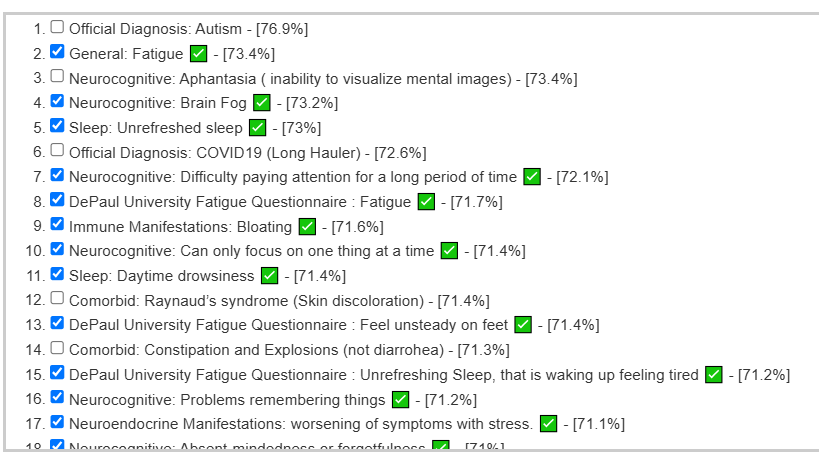
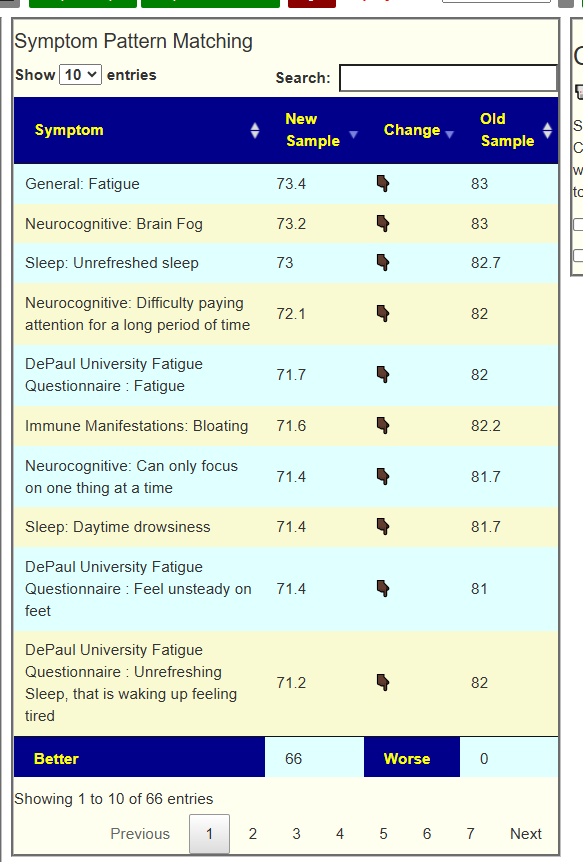
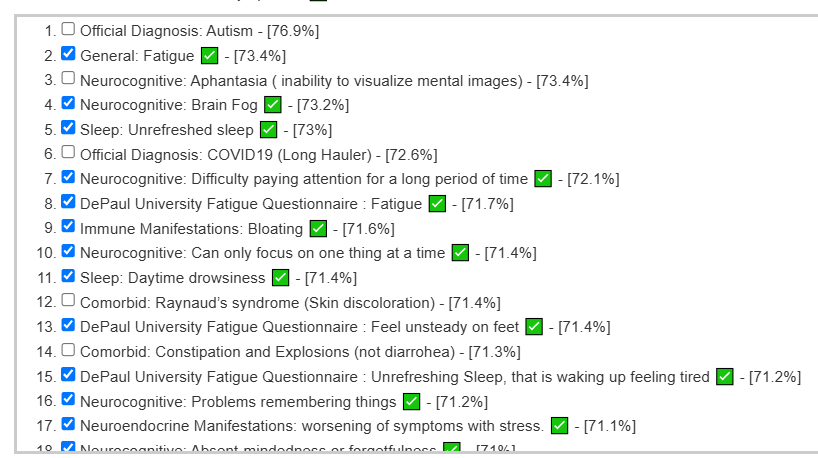
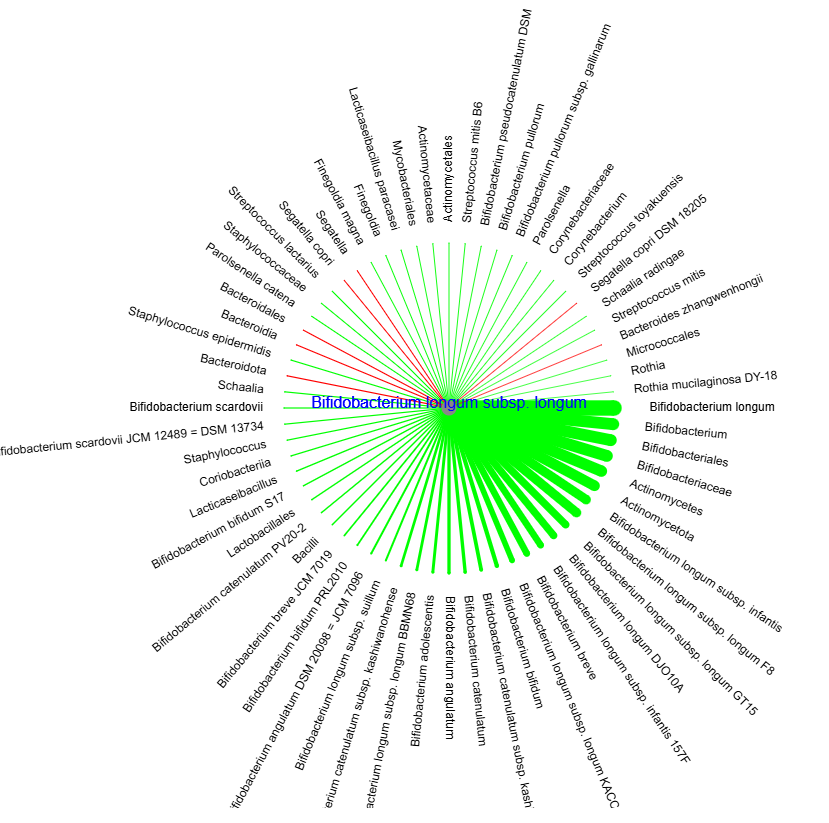
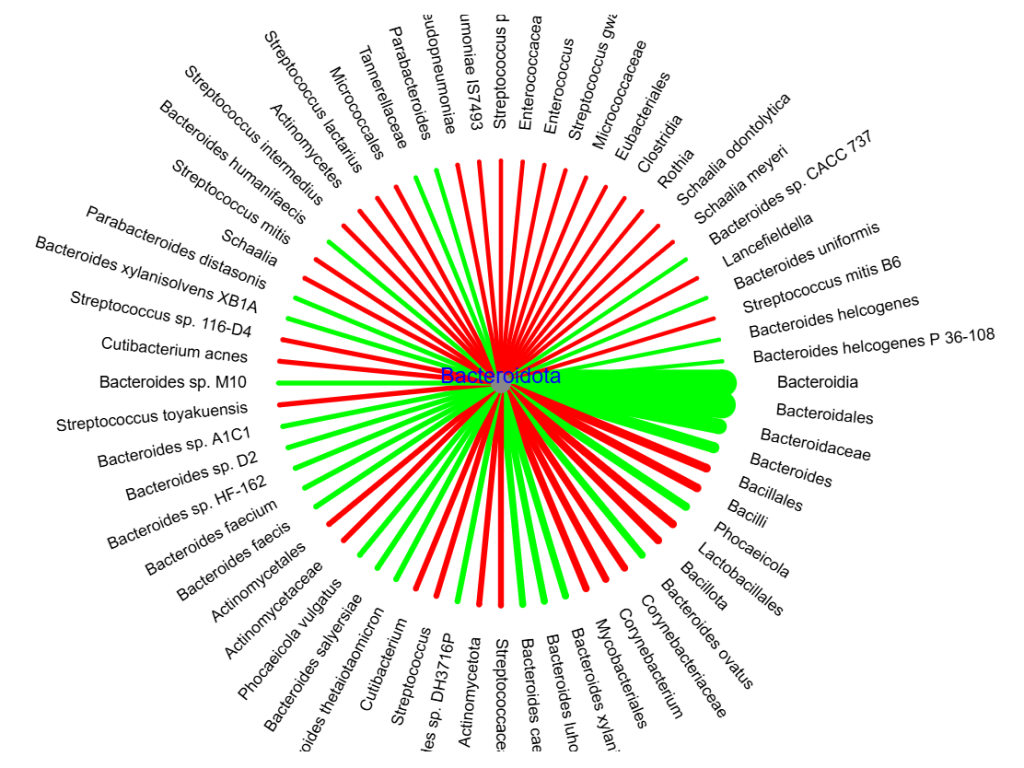
A recent educational analysis that I did had a high rate of correctly predicting symptoms. The illustration below are from developing a predictor on a collection of 4000+ samples processed through the same pipeline. The checkmarks are the symptoms that the user confirm having (i.e. a correct prediction).

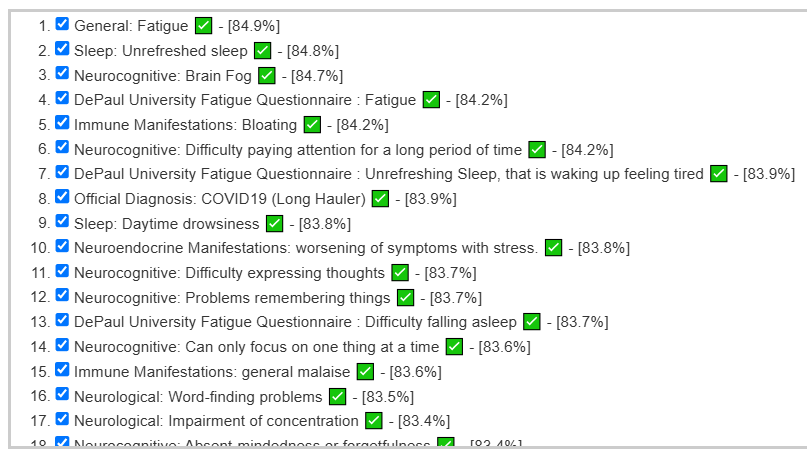
The same person’s earlier sample ( when they had more severe issues) was even more impressive:

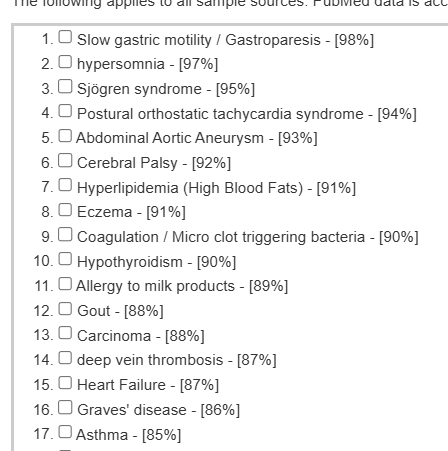
This can also be done using published studies but this has a challenge because of a severe lack of standardization in studies. This translates usually into rare repeatability of results.

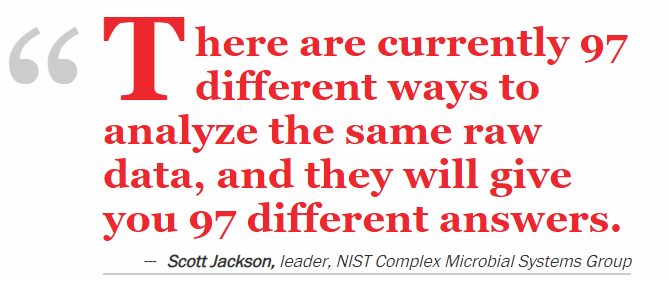
Last week I had a nice session discussing this issue with the Scott whom I cited below.

Ability to provide objective evidence of improvement

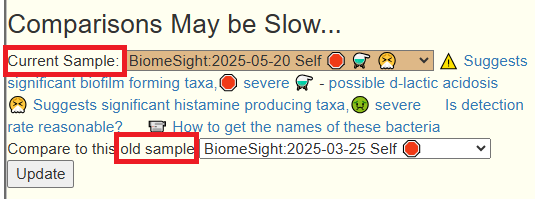
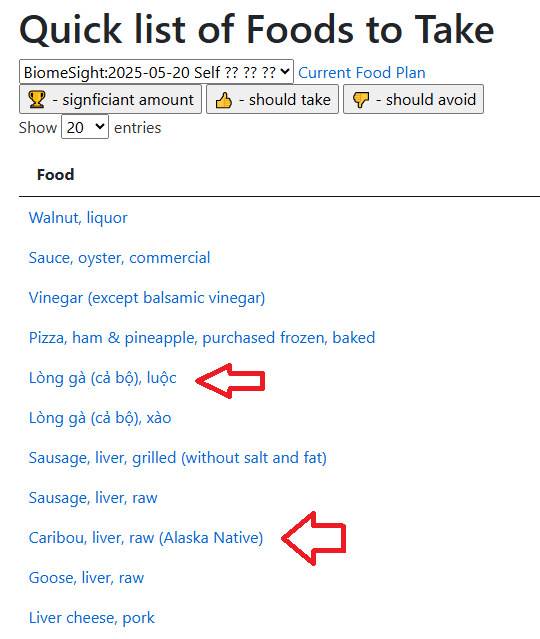
The ability to forecast gives a natural mechanism of evaluation. If the suggestions from the AI improves the microbiome, then one would expect the values for the forecasts to reduce. An example is shown below (full details). In this example, every single forecast value was decreased from implementing the suggestions from the expert system.

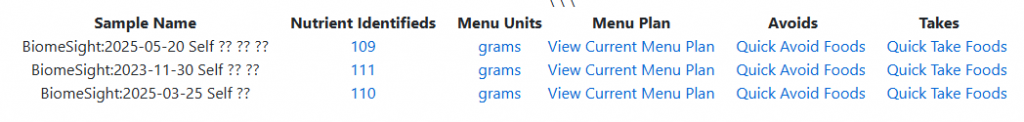
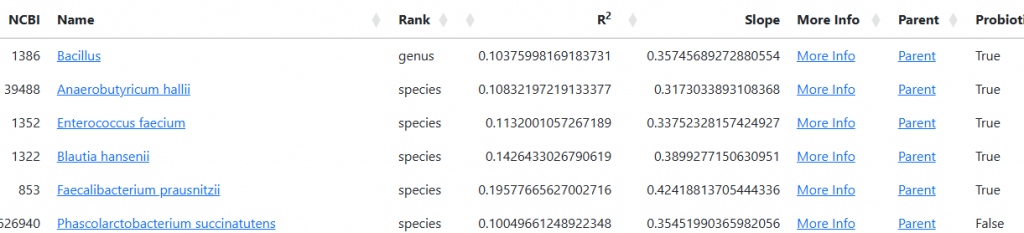
Access to data used above

The microbiome sample data annotated with symptoms that my expert system uses to build algorithms is freely available at my CitizenScience site.

Cheap and sloppy OR Expensive and accurate

Large Language Models (LLMs) are often considered relatively inexpensive to develop compared to earlier AI systems, since they can be trained by scraping vast amounts of text from the internet to identify statistical patterns. In effect, the knowledge these models acquire is based on the aggregate of publicly available information—much of which is uncorroborated or unverified, analogous to hearsay in legal terms.

Legal systems do not accept hearsay as reliable evidence, and this foundational limitation raises significant concerns when LLMs are used in medicine. If an LLM’s output leads to patient harm, its reliance on potentially unreliable or unverified sources could make it difficult for clinicians to defend their actions in malpractice lawsuits, as the standard of care in medicine requires decisions to be based on rigorously validated, evidence-based knowledge. 

Expert Systems are typically costly to develop because their construction relies heavily on human expertise to define and encode logic rules. This process involves painstakingly translating medical knowledge and clinical guidelines into a structured set of rules that the system can follow. Furthermore, encoding the necessary facts into the system demands a thorough review of medical literature by subject-matter experts, which is both time-consuming and expensive.

These challenges are compounded by the nature of medical information itself. Critical data—such as detailed clinical findings, research outcomes, or supplementary evidence—are often found in tables, charts, and appendices within medical articles. Traditional expert systems can be engineered to process these structured formats, but this again requires manual effort and expert intervention. In contrast, large language models (LLMs) struggle to reliably extract and interpret information from such tabular data, as their training is primarily based on unstructured text and is less adept at handling complex, structured formats.

As a result, while expert systems offer the advantage of transparent, rule-based reasoning that can be clearly explained and audited, their development remains resource-intensive. This is due to the need for ongoing expert involvement, meticulous data encoding, and specialized handling of non-textual information that LLMs currently manage less effectively.

Bottom Line

My choice (before LLM days) of using Expert Systems appears to still be the most appropriate. While I currently use some Bayesian mathematics in the model (the “Fuzzy”). I will be digging into Judea Pearl’s Causal Models to see what may be effectively incorporated into the existing model.

I have done a video that walks through some of the other issues involved below.
https://www.youtube.com/watch?v=kUnHucfoxL0&t=1s

And some discussion on Expert Systems
https://www.youtube.com/watch?v=yCP33KbFtXM

Multiple Gut Insults — A mess!

Backstory

  • In September 2023 I suffered a series of gut insults (food poisoning, antibiotics and gastritis) in a very short period. This gave me unrelenting brain fog and cognitive issues, fatigue, tinnitus, sleep difficulties, and a slew of other issues.
  • In an attempt to recover from this I went hard on prebiotics and probiotics, and seemingly without reason these would trigger worsening of symptoms. Looking back at my November 2023 sample (closest after the insult) on your website, I can see some of the items that made me worse, like slippery elm, were at the top of the avoid list! I wish I had an understanding of the website back then...
  • I have undergone multiple killing phases with antimicrobials, which did nothing but make me worse. I now see that building up the good bugs and crowding out the bad is the better technique for my situation.
  • After getting enough of understanding of your website and suggestions I have made some objective improvements in my most recent sample and across the board symptom matches are down. Unfortunately, this hasn’t resulted in symptom improvements (yet).

Today

  • My worst symptoms remain brain fog (cognitive issues, fuzzy thinking, memory issues, etc), fatigue and tinnitus. I remain bedbound since the event in 2023.
  • I believe your approach of focusing on enzymes and compounds are more likely to result in improvements for me than just targeting bacteria changes.
    • Upon reviewing my enzyme and compound movements, pre and post 2023, there are some that are likely to be causing my cognitive issues and maybe fatigue (such as very low L-LDH, high H2S, etc). What do you think about this?
  • Based on the most recent sample suggestions I am using apple cider vinegar, BB536, cannabinoids and dandelion.

Preliminary Analysis

Using [Old Menu] / [Multiple Samples] is my usual start point when there are multiple sample.

I did a compare of the latest sample [2025-05-20] with [2025-03-25] and everything was better!

This person has a series of samples, so I am going to compare each against the prior to see the trend over time. The first sample marked with symptoms was 2023-11-30. Total is the count of distinct symptoms reported from prior and current sample.

SampleBetterWorseTotal
2024-02-02 7115
2024-09-0578078
2024-10-3007979
2025-02-200170
2025-03-251077
2025-05-2066066

There was a dramatic reversal in September 2024 which appears to be starting to correct itself in May 2025.

Going Forward

My approach is a three step approach.

  • Use the symptom patterns to identify the most likely bacteria involved. Then look for the best probiotics to address them
  • Use the symptom patterns to get a list of suggestions
  • Do a generic (not using symptoms) to get a 2nd set of suggestions

First step, using the symptoms to identify bacteria of interest and then get suggestions. We have a high rate of match for forecast symptoms and actual symptoms — which is a good indicator.

The result was just 6 bacteria identified as off.

BacteriaRankShift
DysgonomonadaceaefamilyLow
ErysipelotrichaceaefamilyHigh
ErysipelotrichalesorderHigh
ErysipelotrichiaclassHigh
HathewayagenusLow
NegativicoccusgenusHigh

For comparison, I did the same for the prior sample and instead of 6 bacteria, we had 18. Four are in common with the above.

Focus on Probiotics ONLY

We have the most information on probiotics. We have the following sets of data to work from:

  • Clinical Studies: Certain probiotics are heavily studies, others are not. Often reporting of changes is on a few bacteria. Studies populations are small resulting in only strong associations.
  • KEGG Data on Metabolites and Enzymes: Complete coverage of all probiotic bacteria. Ignores epigenetics and related issues, i.e. we assume everything is “turned on”. Yeasts (i.e. aspergillus oryzae, Saccharomyces) not included.
  • Taxa R2 Site : Complete coverage of all probiotic bacteria and full taxonomy. Yeasts (i.e. aspergillus oryzae, Saccharomyces) not included.

Our goal is determine the bacteria probiotics that every diverse methods agree upon. That is the “consensus” or conservative Monte Carlo Model.

Experiment R2 approach

I went to Microbiome Taxa R2 Site to see if there are any probiotics that would be suggested based on these. I have only listed those currently available (not pending)

Clinical Studies

I checked probiotics and found the top 2 were Bifidobacterium and thus should be avoided? Why do I trust R2 over clinical studies… simple — clinical studies are sparse for data. Just bits and pieces of the puzzle. R2 is far more complete.

Take items:

So we have three probiotics with a consensus and two yeast type probiotics

KEGG Bases

Probiotic computed from Kyoto Encyclopedia of Genes and Genomes compounds and  Probiotic computed from Kyoto Encyclopedia of Genes and Genomes Enzymes have the following with a positive value

And then Experimental Using Metabolites also had them on the take list. So we have the three key probiotics that are available retail with consensus for all of the above methods.

Other Suggestions

I am going to start with the Food Menu Planner. This look at some 111 nutrients identified and then at what various foods contain.

The site presents all recent results

The simplest way is to just click the “Quick” lists. It uses food nutrients databases from all over the world, so some items are likely not on your local café menu.

Take Foods:

Picked for common foods:

Avoid Foods

Consensus View

We have some agreement with the above list

Avoids

Takes

My general impression is try to get a single course of each of the two specific antibiotics above (after each course, do probiotics, then the next course, followed by a different probiotic). I see that Rye is positive and wheat is negative… so we will likely be eating 100% rye bread likely with liver paste (that is one of my favorite foods by the way!) and Pizza (light on the cheese).

I would drop BB536 (Bifidobacterium) and keep to:

Remember these are suggestions — not a protocol. suggestions are items you should take a bit more of or a bit less of! The goal is to persuade the microbiome to shift in the right direction. I have only highlighted items of interest, a review of the details should always be done.

Looping back to Brain Fog — typically caused by excessive d-lactic acid. I have several past post on this issue:

Checking your microbiome tree, I see high levels of Veillonella but with a gotcha, Veillonella is mainly Veillonella montpellierensis (99%ile), a novel species. 1/6 of studies on pubmed has this species causing issues like Polymicrobial bacteremia with little known about it. It is not listed on R2 site for Veillonella.

Postscript – and Reminder

I am not a licensed medical professional and there are strict laws where I live about “appearing to practice medicine”.  I am safe when it is “academic models” and I keep to the language of science, especially statistics. I am not safe when the explanations have possible overtones of advising a patient instead of presenting data to be evaluated by a medical professional before implementing.

I cannot tell people what they should take or not take. I can inform people items that have better odds of improving their microbiome as a results on numeric calculations. I am a trained experienced statistician with appropriate degrees and professional memberships. All suggestions should be reviewed by your medical professional before starting.

The answers above describe my logic and thinking and is not intended to give advice to this person or any one. Always review with your knowledgeable medical professional.

An overview of some issues trying to be addressed is described in this video.
https://www.youtube.com/watch?v=kUnHucfoxL0

What is the best microbiome test to do?

For a time, the answer to this question was straightforward: uBiome.com was the go-to choice for microbiome testing. However, uBiome went out of business in 2019 following legal and regulatory issues, including an FBI investigation and bankruptcy1 3 . As a result, uBiome is no longer an option.

Today, for most individuals—especially those not working directly with a specialist—the best available test is offered by BiomeSight.com (There is a discount code “MICRO” that may still be available).  Unlike many other platforms, BiomeSight allows users full access to their raw data, supports data uploads from other providers, and offers advanced tools for those who want to explore their results in depth. Critically, they have the easiest transfer of data to Microbiome Prescription.

The reasons for this recommendation are detailed below.


Declaration of Interests

I do not sell any products or offer any services, nor do I have any financial interest in any microbiome testing companies.

My experience with microbiome dysbiosis, both personally and within my family, motivated me to develop Microbiome Prescription. Initially, I wrote code for my own use on my personal computer. Over time, I transitioned the platform to the web so that it could be accessible to everyone.

I offer data on Microbiome Prescription freely to individuals out of compassion for the suffering of others and as part of religious obligation-duty. Feel not! I will not preach.

An extreme shortage of expertise

The typical medical doctor or naturopath receives surprisingly little training on how to influence or manipulate the microbiome—often less than what you could learn from a focused day of watching YouTube videos. Most of their education is based on memorizing standard treatment protocols, which they then apply to patients in a “cookbook” fashion. For example:

  • If a patient has Crohn’s disease, prescribe these drugs.
  • If someone struggles with insomnia, suggest these herbs.

The core issue is that treatments are usually prescribed based on the diagnosis alone, rather than being tailored to the individual’s unique microbiome. In effect, practitioners are relying on broad stereotypes rather than personalized care.

Many healthcare practitioners have limited familiarity with the vast diversity of gut bacteria, often focusing narrowly on well-known genera like Lactobacillus and Bifidobacterium due to gaps in training and the complexity of microbiome science. Practitioners will often focus on these because they know no better. They do not know the significance of high Sphingobacterium bambusae or  Dolichospermum curvum

First Question: Who will interpret the results?

There are common paths that people take:

  • The lab themselves.
    • If they sell any product, there is a huge conflict of interest between their financial health and your personal health!
    • Often their suggestions are based off trolling the internet or using existing AI search engines
      • Most AI is prone to hallucinations
    • Often they may be based on a single study found on the US National Library of Medicine
    • I know one startup in this area that has a team of 6 Ph.D.s (or candidates) building a superior database than what Microbiome Prescription gas. They are barely 10% done. That is a very significant cost and needs significant financial backing to do. It requires a strongcommitment to not do a “good enough” to keep investors happy.
    • Word of warning: uBiome.com was one of the earliest labs and dominated the market. They filed for bankruptcy, IMHO due to investor pressure to turn a profit. Many labs keep expenses to the minimum and do not do due-diligence.
  • The healthcare practitioners that you are using and a specific test that they recommend. This assumes that they have been trained on the test. Buyer Beware: many will keep to cook book recipes.
  • You will go off and find a consultant to interpret the test. Conceptually that sound wise. The problem is that there are so many tests out there and finding someone with experience and successful track record is likely very hard.
  • You take ownership and education of the issue using selective resources, for example Microbiome Prescription free site. You should review your plans with your regular medical professional to insure no clear adverse issues with you medical history. In short, you are not asking them to develop a plan — you are asking them to make sure this plan is reasonable with no known health risks.

Amount of information in Test Result

The table below gives the possible test types. Typically:

  • qPCR gives 30-100 bacteria
  • 16S gives 600 bacteria
  • Shotgun gives 6000 bacteria

IMHO 16S is the best give what we know about how to change the microbiome.

MethodWhat It MeasuresStrengthsLimitations
16S rRNA SequencingBacterial taxonomy (genus level)Cost-effective, widely usedLimited resolution, misses non-bacteria
Shotgun MetagenomicsAll DNA (all microbes, functions)High resolution, functional insightsExpensive, complex analysis
qPCRSpecific DNA targetsRapid, quantitative, targetedLimited scope, requires known targets
Culture-BasedViable, culturable microbesFunctional studies, viability assessmentMisses unculturable microbes
MetatranscriptomicsActive gene expression (RNA)Reveals microbial activityTechnically demanding, expensive
MetaproteomicsProteins producedFunctional protein insightsComplex, needs advanced equipment
MetabolomicsMetabolites (small molecules)Functional metabolic readoutSource of metabolites often ambiguous
Specialized SamplingMicrobes from specific locationsSpatial resolution, targeted samplingInvasive, technically challenging

What test gives the most actionable items using Microbiome Prescription database and expert system?

As a statistician, sample size determines the ability to detect patterns, make forecasts and thus identify the key bacteria connected to your symptoms.

  • BiomeSight has 4382 samples
  • OmbreLabs/Thryve has 1530 sample
  • Every other labs has less samples.

See Bacteria by Symptoms by Lab that are high or low for symptoms that can be accurately predicted from a microbiome:

  • BiomeSight has 308 Symptoms – thus we know which bacteria of the 600 to focus on
  • OmbreLabs/Thryve has 86 Symptoms
  • uBiome has 67 symptoms

There are a few things that 16s does not detect which shotgun does (virus, phages, antibiotic resistance etc). A small number of people may need that information … unfortunately, the ability to detect which bacteria are responsible for your symptoms is lost.

For more background, you may want to watch this video.

This recent discussion with a Long COVID patient that used Biomesight and the data from Microbiome Prescription may be helpful.

Obesity and Probiotics

Fecal Transplants has shown the obesity is very microbiome controlled. With no change of diet, a lean mouse with a fecal matter transplant from a fat mouse, became fat.

Image from Obesity and Gut Bacteria: Fecal Transplant Causing Obesity? [2015]

Like the song about White Rabbit by Jefferson Airplane (referencing Alice in Wonderland book), we need to make sure we take the right (probiotic) pill.

One pill makes you larger
And one pill makes you small
And the ones that mother gives you
Don’t do anything at all

Severity of Issue

Human Studies

When used as single-strain, all probiotic interventions showed positive effects in decreasing body weight, BMI, waist circumference, body fat mass or fat percentage. These strains belonged to the genera Lactobacillus (L. rhamnosus CGMCC1.3724 (LPR) [25], L. gasseri BNR17 [38], L.gasseri SBT2055 [27], L. sakei CJLS03 [46] and L. plantarum Dad-13 [49]), Bifidobacterium (B. lactis Bb-12 [36], B. animalis ssp. Lactis 420 (B420) [51], B. animalis CECT8145 [39]) and Pediococcus (Pediococcus pentosaceus LP28 [34])…. a maximum dose of 5 × 10¹⁰ (50 BCFU)

many of the studies the probiotic/synbiotic intervention was accompanied by dietary or physical activity interventions, which may have hidden the real effect of the probiotic strain(s) used.

Effects of Probiotics and Synbiotics on Weight Loss in Subjects with Overweight or Obesity: A Systematic Review [2021]

Probiotic supplementation may also cause weight gain. Jones et al. [122] conducted trial in 19 obese adolescents, administering three packets per day of a mixture probiotics (L. acidophilus BA05, L. plantarum BP06, L. paracasei BP07, L. delbrueckii subsp. bulgaricus BD08, B. breve BB02, B. longum BL03, B. infantis BI04, and S. thermophilus BT01) for 16 weeks. Compared to placebo, observed a statistically significant increase in body weight in people using VLS#3. 

Probiotics for the Treatment of Overweight and Obesity in Humans—A Review of Clinical Trials [2020]

The case from Rhode Island (or mom gets fecal transplant and gains weight).. When Stacy returned to clinic 16 months later she had gone from 136 pounds to 170 pounds” [2015]

From Perplexity: “Systematic reviews and meta-analyses highlight that combinations of various Bifidobacterium and Lactobacillus strains tend to be more effective than single-strain probiotics for reducing body weight, BMI, waist circumference, and body fat mass”

Vet Studies

These appear to lack dietary or physical activity interventions and thus may be preferred combinations.

Model

My model is simple, events pushed someone into a obesity dysbiosis where it become “stuck”. The dysbiosis has a distinct metabolite mixture that alters the human brain to prefer foods that feeds the dysbiosis. The metabolites results in higher efficiency of fat and protein absorption which the body then stores.

If you can alter the bacteria (and thus metabolites) to less efficiency then weight loss may occur naturally. There is some evidence that this may be possible with appropriate probiotics.

Exploration

Going to bacteria shifts seen with Obesity, the most repeated taxa showing the same direction of shift reported from studies are:

  • Akkermansia muciniphila – LOW, available as a probiotic
  • Pseudomonadota  – HIGH
  • Alistipes  – Low
  • Faecalibacterium prausnitzii  – Low

And Bifidobacterium are mixed, some high and some low.

Using the new Microbiome Taxa R2 Site, I looked at the top 4 and which probiotics shifts in the right direction:

So the common candidates come down to

Bottom Line

Without dietary or physical activity interventions, I believe that the Vet/Dog Studies probiotic pairs are likely the best (study evidence based) with the suggestions from the above exploration being very reasonable.

I have personally tried those combination and slowly loss weight with no clear dietary or physical activity interventions. The source that I used (I trust Maple Life Science for being correctly identified and fresh from the fermentation vat): Click to go to ordering page [No financial interests].

With “Plan B” being

Take at least two at the same time. Be Lean!

AI Review of the above is available here.

Bacteria Association – R2.MicrobiomePrescription.com

I’m excited to share the launch of R² Microbiome Prescription (https://R2.MicrobiomePrescription.com), a platform dedicated to unraveling bacterial associations in the microbiome. The name “R²” reflects the Coefficient of determination—a statistical measure showing how strongly one variable (like one bacterial presence) correlates with another (e.g., a different bacteria presence). Think of it like income and spending: as salary rises or falls, spending often follows, though this doesn’t prove salary causes spending changes.

Why focus on associations?
While correlation ≠ causation, I lean toward the idea that bacterial relationships in the gut often hint at underlying causal mechanisms. For instance, one microbe’s metabolites might directly feed or inhibit another, creating a metabolic chain reaction. With thousands of metabolites (and counting!) interacting in complex ways, pinpointing exact cause-effect relationships is like solving a 4D puzzle.

The challenge ahead
Current research is racing to map these connections, but the sheer scale of interactions—combined with individual variability—makes definitive conclusions tough. My goal with R² is to aggregate data, spotlight patterns, and inspire deeper exploration into how these microbes might shape health.

Feel free to explore the site and join the conversation!

Keep It Simple Statistics (KISS)

Over the years, I’ve experimented with various methods to uncover meaningful bacterial associations—a journey that’s been both challenging and gradual. After much trial and error, I finally developed a methodology that consistently delivers reliable results, which I’ve now used to populate the new site.

A turning point came during discussions with Precision Biome. They encouraged me to apply this approach to their extensive dataset of shotgun sequencing samples from healthy individuals. This collaboration provided the perfect opportunity to put my method to the test on a large scale—and ultimately led to the creation of the site you see today.

Getting R2 by Percentages

Here’s an example of a clear association between two taxa using percentages of each in samples:
R² = 0.6971 and Slope = 0.3563.

An R² value of 0.6971 indicates that nearly 70% of the variation in one taxon’s abundance can be explained by changes in the other, reflecting a strong linear relationship between them. The slope of 0.3563 shows the rate at which one taxon’s abundance changes in relation to the other—specifically, for every unit increase in one, the other increases by about 0.36 units.

This kind of result highlights how statistical measures like R² and slope help quantify and visualize associations within complex microbiome data.

The relationship is typically not so linear. This was a specific example picked for illustration.

[BELOW] Applying a monotonic increasing transformation like the square root to the data changes the association metrics: in this case, R² drops to 0.5112 and the slope increases to 0.5405, indicating a weaker linear relationship compared to the original analysis. This reduction in R² means the transformed data explains less of the variance between the two taxa, making the association less robust than before.

Square root and similar transformations are commonly used in microbiome studies to stabilize variance, handle skewness, and address issues like zero-inflation and compositionality in the data. However, these adjustments can sometimes reduce the strength of observed associations, as seen here, because they alter the data’s distribution and the nature of relationships. Our goal is not to get a linear relationship, rather to get the best while preserving the nature of the data (i.e. all transforms should be monotonic increasing transformation)

[BELOW] Applying a different monotonic increasing transformation, such as taking the logarithm of the data, yields R² = 0.6596 and Slope = 1.0046. This result is an improvement over the square root transformation, as indicated by the higher R² value; but less than the first linear one.

A logarithmic transformation is often used to manage skewed data and compress large ranges, making relationships more linear and easier to interpret. In this case, the higher R² suggests that the log transformation preserves more of the association between the two taxa compared to the square root transformation. The slope of 1.0046 indicates a nearly one-to-one relationship between the log-transformed values of the two taxa.

[BELOW] We can also experiment with other transformations to see how they affect the association. The more complex transformation that I prefer yields R² = 0.7082 and Slope = 0.5015.

This R² is the highest among the transformations tested so far, indicating that this method captures the relationship between the two taxa most effectively. The slope of 0.5015 shows a moderate rate of change between the transformed values of the taxa.

This example highlights how choosing the right transformation can significantly enhance our ability to detect and quantify associations within microbiome data. By carefully selecting and testing different approaches, we can better reveal the underlying patterns and relationships that might otherwise remain hidden.

R2 is the amount of influence, slope indicate direction of influence

It’s important to avoid combining R² and slope by multiplying them together. This is not a standard or meaningful statistic in regression analysis and can easily lead to misinterpretation. For instance, a high slope with a low R² suggests that while changes are dramatic when they happen, the overall model does not explain much of the data’s variance.

Remember:

  • Slope tells you the direction and rate of change (whether the relationship increases or decreases).
  •  indicates how much of the variation in one variable can be explained by the other (the strength of the association).

Each metric provides valuable information on its own, but their product does not offer any additional insight and can actually be misleading.

Criteria for selecting transformation

For any given pair of bacteria, it’s technically possible to find a data transformation that maximizes the R² value for that specific pair. However, with 5,000 taxa, there are over 25 million possible pairs (5,000 × 5,000), making it an overwhelming and impractical task to optimize each one individually.

Ideally, the goal is to identify a single transformation that performs well across both low and high R² values for all pairs. Discovering such a transformation was a significant part of my journey. To keep the analysis manageable, I focused only on bacteria present in at least 0.3% (0.003) of the samples, which helped reduce the number of pairs to a more reasonable level.

I’ve found a favorite transformation—demonstrated in the last chart above—that I’m particularly satisfied with. If I discover an even better transformation in the future, I simply rerun the analysis and select the one that yields the highest R² values. This approach ensures that the associations presented are as strong and meaningful as possible.

A practical alternative is to run regressions with multiple transformations and picked the transformation for each bacteria pair that has the highest R². I would suggest some of the following transformation be tried:

  • linear function with positive slope
  • cubic function
  • square root function (converting percentage to 0 – 1 range)
  • exponential function with base e
  • natural logarithm
  • logistic function
  • general exponential function
  • x−sin(x)
  • x/(log(x)

This will increase the computations from 25 million to 250 million. Remember computer resources are cheap today (say he would started doing statistics using a HP-21 calculator and WatFor). And fast using parallelism (multiple cores and threads).

Usage With Probiotics

Suppose your Bacteroidota levels are too high and you’re considering which Bifidobacterium probiotic to take. If you turn to published studies, you’ll notice that most research focuses on individual probiotic strains, making it difficult to directly compare their effects. Instead, let’s examine the comparative data in the charts below to help guide your choice.

Bifidobacterium adolescentis: NCBI 1680, [species]

Does not impact any bacteria!! Definitely a pass.

Bifidobacterium bifidum: NCBI 1681, [species]

We see some impact, with R2 being 0.10. it has little impact on other bacteria

Bifidobacterium breve: NCBI 1685, [species]

This does reduce some bacteria, and Bacteroidota has R2 0.12 (20% better than above)

Bifidobacterium longum subsp. infantis: NCBI 1682, [subspecies]

For this one, we have R2 being 0.144 — best yet!

Bifidobacterium longum subsp. longum: NCBI 1679, [subspecies]

For this one, we have R2 being 0.153 — best yet!

Starting at the target Bacteroidota

Are target is Bacteroidota: NCBI 976, [phylum]. We see the top 64 bacteria in the chart. The table below has 134 entries with R2 of 0.10 or more

We can then search the table at the end for the best probiotics.

“Buyer beware,” or caveat emptor

The harsh reality is that we cannot trust most bacteria identification with the microbiome and with probiotics.

Precision Biome (who supplied the dataset) are doing things what I deem the right way:

  • They are using the same pipeline that the above data came from (no ambiguity in bacteria identification) for client samples that they received.
  • They are working with an EU probiotic manufacturer directly.
    • The contents of the probiotics is also verified with the same pipeline
    • The probiotics come directly from the factory and are not stored in questionable environments before being delivered to the client
  • They intend to use the data from this site in identifying the best probiotics for each client

This is (IMHO) the ideal trifecta for clinical use of the microbiome. It is the strategy that I hope responsible microbiome testing firms move to.

Quick Test

Some one asked about probiotics that reduces Campylobacter. The page shows known (and pending) probiotics. We found none listed to reduce it. We did find some that increases it.

Going to Campylobacter Details: NCBI 194, a page that consolidated studies we found:

Bacillus is a genus and covers many species — so difficult to evaluate.

Not as good as actual studies? — but reasonable for sparse data

Critical Evaluation of Microbiome Study Limitations & Proposed Solutions

Key Factors Impacting Credibility

Current microbiome research faces significant validity challenges due to three core assumptions:

  1. Taxonomic Accuracy of 16S rRNA Sequencing
    • The 16S pipeline (used in >80% of studies) has notable limitations:
      ▪ Struggles with species/strain-level resolution
      ▪ Database gaps create misclassification risks
      ▪ PCR amplification biases skew abundance data
  2. Probiotic Product Integrity
    • Studies often assume supplements match label claims, yet:
      ▪ DNA analyses show 30-50% mislabeling in commercial probiotics
      ▪ Viability issues occur in 40% of products (esp. non-refrigerated)
      ▪ Strain-specific effects are frequently overlooked
  3. Population Generalizability
    • Most trials use narrow cohorts:
      ▪ 78% of probiotic studies focus on healthy adults
      ▪ Gut ecosystem dynamics differ in:
      • Chronic disease states
      • Antibiotic-treated individuals
      • Elderly/immunocompromised populations

I prefer the trifecta approach over blind faith that all of the above assumptions are true. Blind faith is reasonable when you have no better data — the odds are that it will be better than no data.

Illustration of a different pair

With our special monotonic transformation: R2 =0.23