A few days ago I posted the results for Bacteria Association (with graphics). I did some operations Research black magic in transforming the data. This black magic is a key part of a patent application that has been filed.
Over the last decade, I have been focused on understanding the statistics of the microbiome bacteria. My multiple degrees are in Probability and Statistics, hence the desire to build mathematical models for the microbiome bacteria.
One of my key observations is that “one model does not fit all taxa“. One observation is very consistent: no bacteria fits the gaussian (normal or bell curves) rendering the use of mean and standard deviation not only suspect, but naively dumb.
This post exhibits the challenges. We take 1000 Shotgun samples of healthy people using 10 million reads and look for associations by doing classic linear regression. We apply a variety of monotonic increasing transformations to the percentage/counts and see where we get the most relationships with R2 > 0.25.
First Pass Analysis
I decided to see how well “common textbox solutions” would do compared to my “Black Magic” monotonic increasing transformation. If people want to suggest other monotonic increasing transformations, I am very willing to run other transformations on this dataset and add it to this report.
| Method | “Black Magic” | Using Percentage / Count | Using Log(Count) |
| Number of R2 > 0.25 | 15,183 | 1,764 | 9,616 |
| Number with higher R2 | 1,356 | 7,167 | |
| Number with lower R2 | 408 [13,827] | 2,449 [8016] |
The [ ] is the sum of not found and lower R2.We see that the “Black Magic” clearly found more statistically significant relationships. Taken in isolation, “Black Magic” also found more relationships with a higher R2. The Log(Count) items with a higher value are worth some extra analysis.
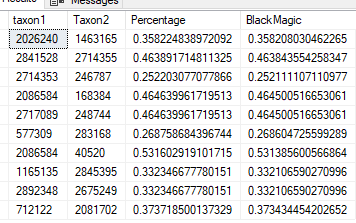
Percentage or Count
This is the typical naïve approach used by people who rote-learn statistics. We found only 10% of those we got via “Black Magic”. Many relationship were very similar, they tend to be for bacteria with low rates of detection (i.e. occurs in < 25% of samples) and low amounts of bacteria. To translate, very few distinct values in these subsets.
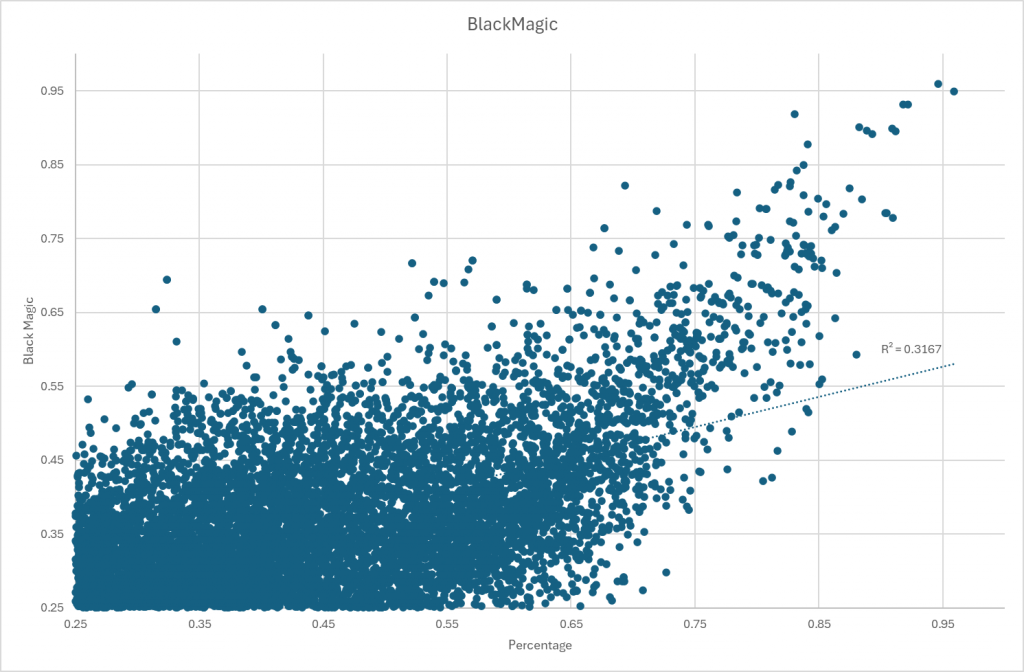
Other has significant differences
A chart comparing results.
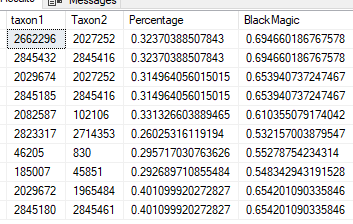
Log(Count)
Using a log(values) is a common statistical trick dealing with non-gaussian (normal/bell curve) data to get semi-normal data. For R2 that were higher than “Black Magic” we have:
- Mean Difference: 0.23
- StdDev Difference: 0.09
- Maximum Difference: 0.43
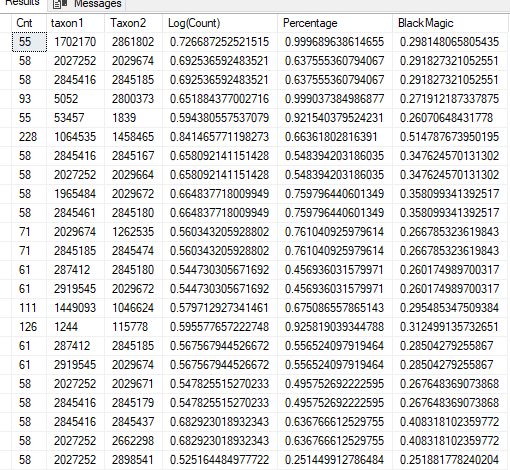
We have a sample of the greatest difference below, and note that the sample size was relatively small. The top line has R2 of 0.999. This suggests that we may need to exclude taxa that has less than N distinct values (a possible follow up post)
Restricting to samples where we have 300 or more (incidence of detection: 30%). In this case Log(Count) with higher R2 exceed those with lower R2 compared to “Black Magic”
| Method | “Black Magic” | Using Percentage / Count | Using Log(Count) |
| Number of R2 > 0.25 | 10,733 | 702 | 8,121 |
| Number with higher R2 | 494 | 6130 | |
| Number with lower R2 | 208 [10239] | 1991 [4603] |
Bottom Line
Log(Count) produces acceptable results while failing to detect 20% of those detected by “Black Magic”. The ideal solution would be to do both methods and take the highest R2 from each regression. I await other suggestions for monotonic increasing transforms to try. It is very clear that using counts / percentage is a poor statistical choice.
There is a follow up post suggested based on the density/sparseness of different values. Having too few distinct values appears to over-fit and produce suspect/false higher R2.
Recent Comments