A reader wrote:
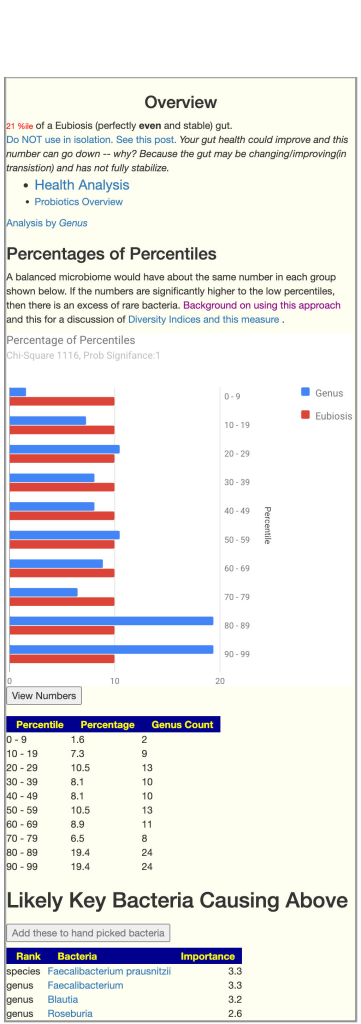
After uploading my sample, it gave a chi-square score of 1116 (image attached). Does this warrant any change in treatment approach (just asking as most of the scores I’ve seen posted on your blog are below 100)?
The short answer is no. This indicate that dysbiosis is likely happening. It is likely that is already known (hence getting a test).
The Simple Logic
We look at different bacteria at the genus level. Naively, this should be the equivalent of having independent variables. For each bacteria, we get the percentile ranking (in terms of a reference population). The odds of any bacteria being in the 1-10%ile range is 1 in 10. The same applies to every other range and bacteria.
This becomes a simple statistics problems. We would expect every range to have about 10% of the genus in it. We can then calculate whether the actual distribution conforms to this expectation using Chi-Square. If there is no dysbiosis, we would expect the significance to be 0.95 or less. Many users have significance being 0.9999 or higher; that is, very strong indicator of dysbiosis.

In the above example, we have definite dysbiosis. We have a large number of bacteria that are too high percentile. We do not know the precise ones that are problematic, we have a list of possible bacteria that we would want to reduce.
Since we do not know the explicit bacteria to focus on (only a collection of candidates), we cannot generate suggestions explicitly from this information.
Technical Note: The Percentile is computed from those reporting some of each genus. The percentile could be done across all tests (i.e. not found included); that approach results in a much more complicated computation.
I view Chi-Square as a better alternative to Diversity Indices. Most diversity indices apply to only certain condition. IMHO, it is a more robust measure because it is based purely on statistics and uses a reference set.
The Shannon index has been studied in relation to:
- Septic shock: A study found that low bacterial diversity (Shannon index <3.0) was associated with higher 28-day mortality rates in septic shock patients1.
- General health status: The Gut Microbiome Health Index (GMHI), which incorporates the Shannon index, was used to distinguish between healthy and non-healthy individuals across various conditions2.
- Parkinson’s disease: However, a study found that the Shannon index was not significantly associated with Parkinson’s disease or other neurological disorders6.
In microbiome studies, several diversity indices are frequently used to analyze the composition and structure of microbial communities. These indices can be broadly categorized into two types: alpha diversity (within-sample diversity) and beta diversity (between-sample diversity).
Alpha Diversity Indices
- Shannon index: Measures both richness and evenness of species in a community.
- Simpson’s index: Reflects the probability that two randomly selected individuals belong to different species.
- Chao1 index: Estimates species richness, particularly useful for data sets skewed toward low-abundance classes.
- Observed number of Amplicon Sequence Variants (ASVs): Counts the number of unique sequences in a sample.
- Phylogenetic Diversity (PD): Considers the evolutionary relationships between species.
- ACE (Abundance-based Coverage Estimator) index: Estimates species richness, accounting for rare species.
Beta Diversity Indices
- Bray-Curtis dissimilarity: Considers both the presence/absence and abundance of species.
- UniFrac:
- Unweighted UniFrac: Considers presence/absence of species and their phylogenetic relationships.
- Weighted UniFrac: Incorporates abundance information along with phylogenetic relationship.
- Jaccard index: Measures the similarity between sample sets based on presence/absence of species.
These diversity indices provide different perspectives on microbial community structure and are often used in combination to gain a comprehensive understanding of microbiome diversity36.
Recent Comments