The following looks at a holisitic approach to generate suggestions for microbiome dysfunctions, symptoms (that may be microbiome associated) and diagnosis (that have microbiome patterns).
This model (or variation there of) is being used by several microbiome testing companies today. See the bottom for example of clinical success.
This post illustrate the process and is not a precise match for current implemenation on Microbiome Prescription (which continuously evolves over time).
Native taxa weights
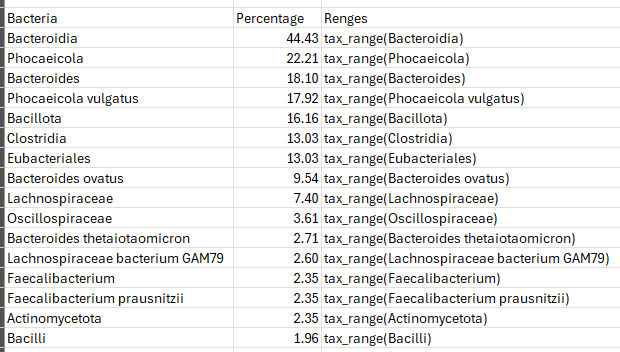
The first step is to get a weight for each taxa in a sample to identify what should be altered and the importance of each. With shotgun samples, there may be over 7000 different taxa.
The simple first step is to just do a lookup compare to ranges for each taxa (assuming there is sufficient data to compute ranges). Then assign weights based on the sample positioning in the ranges. The key function (tax_range) is often a complex function which may incorporate percentage, percentile, gender, age, diet style, and bacteria hierarchy. For example, Lachnospiraceae bacterium GAM79 may dominate and result in Lachnospiraceae being given no weight and thus expert system rules may be involved.
Conceptually, it is the importance of a bacteria to be shifted with the desired direction of shift converted to a numeric value or vector of values.
This is called a native taxa weights .
Presentation taxa weight.
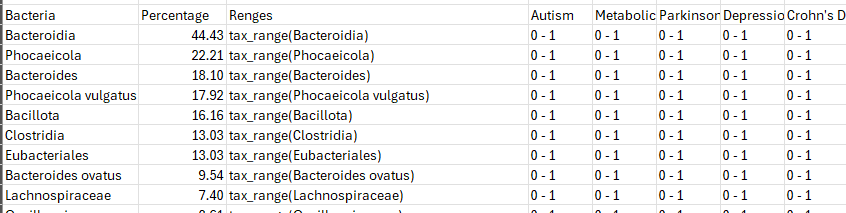
These native taxa weights are then modified by the presence or absences of diagnosis and symptoms. Conditions are not either/or. A good example is Autism which has a wide spectrum of levels. A bacteria known associated with a condition will likely have an increase weight. A bacteria with no known associations will have a decreased or no weight. This is called a presentation taxa weight. As above, it may be a single value or a vector of values.
Modifier Matrix
We drop the taxa weight into our grid as show below. We show the weigh as a single value below. With a positive weight indicating something to increase and a negative weight indicating something to decrease. The “-1 to 1” indicates a factor.
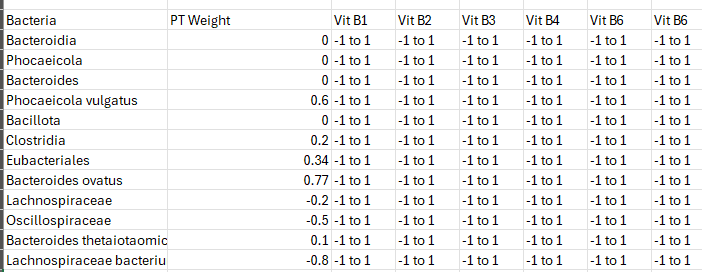
We now want to maximize the value of the suggestions, i.e.
Sum Over All Bacteria( FactorVit B1 * AmountVit B1 +FactorVit B2 * AmountVit B2 + etc)
Amount often becomes a 1 or 0 (take or do not take) when there is no dosage related data. Factormodifier may be multidimension function on occasion. For example, it values may depend on other factors being selected. This can result in iterations that was the goal the Simula programming language. That is, you get the first naive suggestions(no dependencies), then feed the results into the next iteration.
We can rotate our focus to obtain lists of “to take” and “to avoid”
Sum Over All Bacteria( FactorVit B1 * AmountVit B1)
Factors are often computed from a variety of factors, a few examples:
- the number of studies reporting a shift (often studies disagree),
- the magnitude of the shift (and/or P value),
- the modifier (a specific probiotic strain, a probiotic mixture, a species)
- context of the studies (humans, mice, pigs, fish, fouls).
Then We enter the Casino…
Rather than arguing over exactly which formulae for weights are correct. We make use of multiple reasonable formulae. Each is run independently and we then apply Monte Carlo modelling to these results.
Linearity is Dangerous To Assume
Our experience is that assuming linearity produces poor results. We found that doing cross validation allows this host of functions to be tuned.
Inferences should also be factored in, i.e. if a modifier alters Lactobacillus genus without details on individual species, most people will assume that it will alter some of the species — unfortunately, there are many studies reporting that lactobacillus increased with some species decreasing and other increasing.
The key issue is dealing with very sparse data that is often heavily conditioned, i.e.
- Shift(“Wormwood”, “Bifidobacterium” | Autism) < 0
- Shift(“Wormwood”, “Bifidobacterium” | Diabetes) > 0
- Shift(“Fasting”, BacteriaA | “Chinese” ) > 0 (see Ramadan Fasting Leads to Shifts in Human Gut Microbiota Structured by Dietary Composition – PMC (nih.gov) )
- Shift(“Fasting”, BacteriaA |”Pakistan”) < 0
This may explain why wieghts can be vectors of values.
This is where the art of microbiome manipulation comes in.
Clinical Success
Personal Experiences
Via our free for personal use (not commercial/medical office use) we have had many people have done a sample with one of many supported labs, obtained suggestions from the above model and implemented some, and then done a second sample. For everyone that has done this, there has been OBJECTIVE and SUBJECTIVE improvement. I was expecting > 50% only, but we are running 90+%. For example analysis from those who consented to share, see this collection dealing with Long COVID and Chronic Fatigue Syndrome.
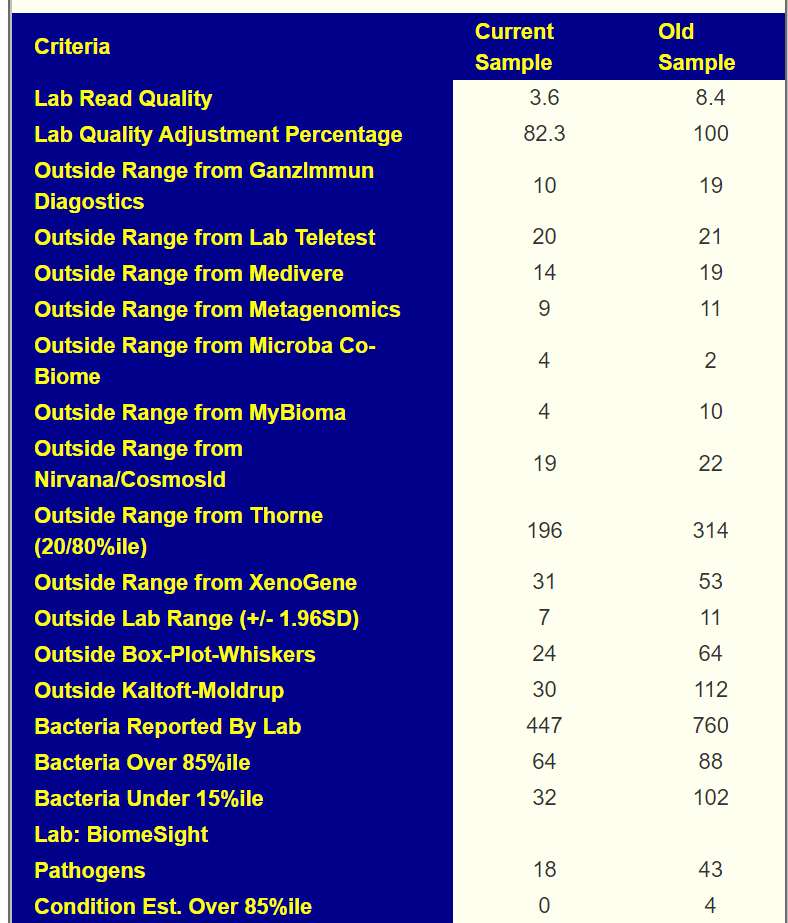
A recent example is shown below using multiple “measuring sticks” from different labs. We see clear improvement.
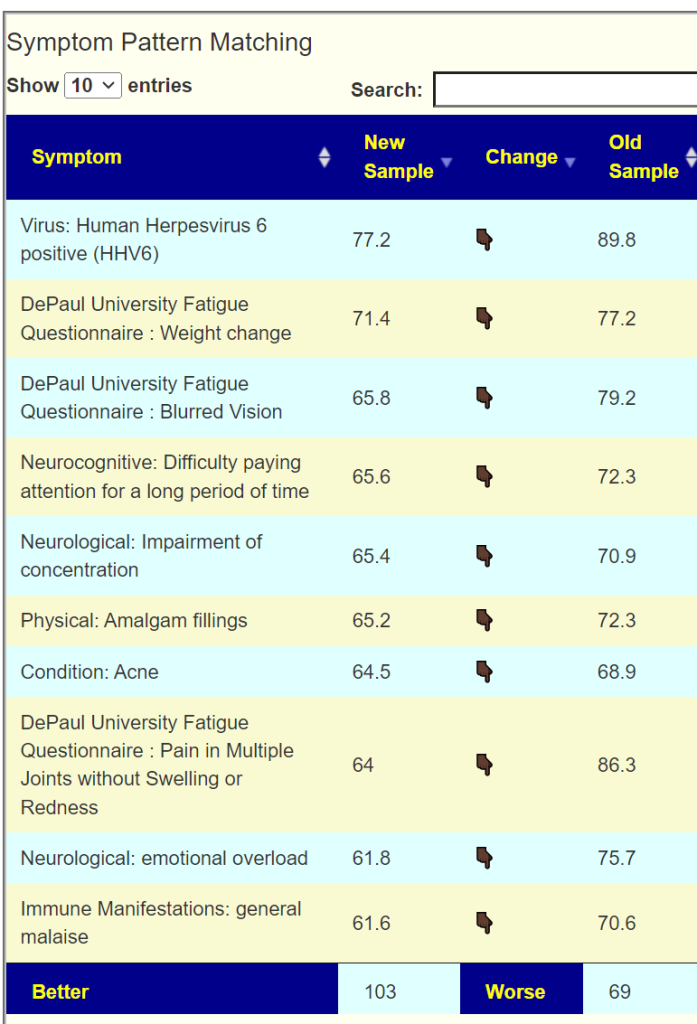
We also have associations of symptoms to bacteria using our 5000+ donated samples annotated with symptoms. Often the associations exceed P < 0.001 on a lab specific basis. From this data we can give percentage estimates on pattern matching to symptoms. Below is an example for the person shown above.
We see improvement across all of the top symptoms.
We do not look at “cure” (that does happen sometimes), but reduction of symptoms as our criteria.
We have had incidental reports of it appearing to improve the success rate and speed of remission for some cancers.
AI Cross Validation
Additionally we have done cross validation against the literature. We take the microbiome shifts reported for a condition across multiple studies, run those shifts through the engine, then see how many of the top suggestions have been found to improve this condition according to published studies using those suggestions. An example is here: Cross Validation of AI Suggestions for Nonalcoholic Fatty Liver Disease .
While not a clinical study as such, it shows that our suggestions appear to agree with results from third party clinical studies.
Recent Comments