This presents an ability to explore symptoms association with the microbiome in different ways. This is pure citizen-science. The information is based on contributed 16s data and contributions of symptoms associated with that data. This is strictly observational.
There are 4 pages available:
- Symptom Summary how often are symptoms reported in the data
- Symptom Bacteria Explorer what bacteria are high,low or normal
- Symptom End Product Explorer what end products are being produced. Different bacteria produce the same chemicals, so it’s looking at the volume of different chemicals reported
- Symptom Metabolism Explorer
- uBiome provide some metabolism reports. Some people have included this data with the upload.
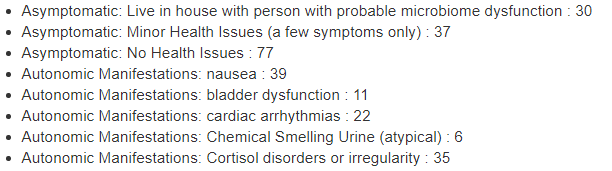
Symptom Summary
How often are symptoms reported in the data.
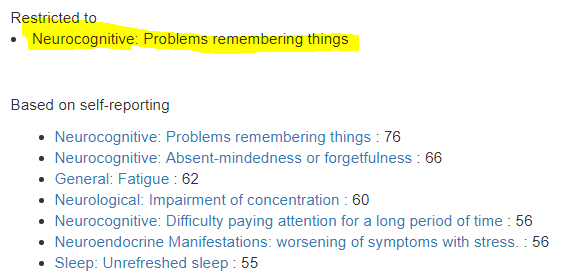
Symptom Bacteria Explorer
What bacteria are high,low or normal. This page allows filtering, click on one symptom and the report is updated to only people with that symptom (and others).
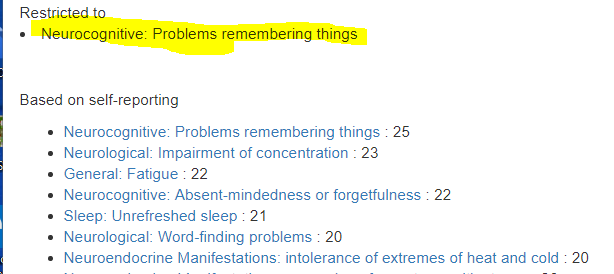
Share Symptoms
As shown below, you can explore people with same symptoms. In this case, we see a large number of people also report unrefreshing sleep.
Bacteria Patterns
Below this first report, you will see the bacteria report.
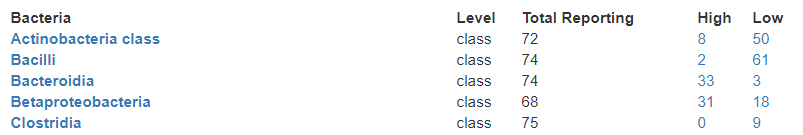
In general, you want at least 60% being high or low before you should suspect associations. Above Clostridia has just 9 low of 75 — it is unlikely that Clostridia levels are associated with these conditions.
It is important to note that some people samples may have zero of a specific bacteria. This means that while we may have 76 samples with symptoms, only 68 had any Betaproteobacteria. It is not abnormal to find one entire family of bacteria missing.
Remember that symptoms are likely associated with the chemicals (metabolites) that bacteria produces, a clean matching to one specific bacteria is unlikely.
Symptom End Product Explorer
What end products are being produced. Different bacteria produce the same chemicals, so it’s looking at the volume of different chemicals reported. This is still very experimental — finding data to populate the tables has been challenging. This is made still harder because one strain of a bacteria may be a high producer and another strain produce nothing.
Share Symptoms
As shown below, you can explore people with same symptoms. In this case, we see a large number of people also report unrefreshing sleep.
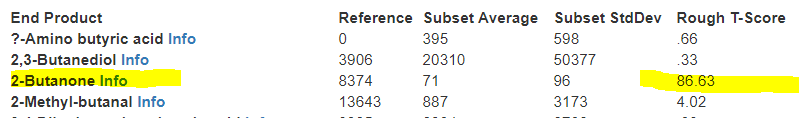
End Product Patterns
This report gets more into technical statistics, the column “Rough T-Score” is an attempt to determine if the difference is significant. A value of at least 3.0 should be seen before an association can be suspected.
Symptom Metabolism Explorer
uBiome provide some metabolism reports. Some people have included this data with the upload. At present, only 30% of people are adding this data.
Share Symptoms
As shown below, you can explore people with same symptoms. In this case, we see a large number of people also report unrefreshing sleep.
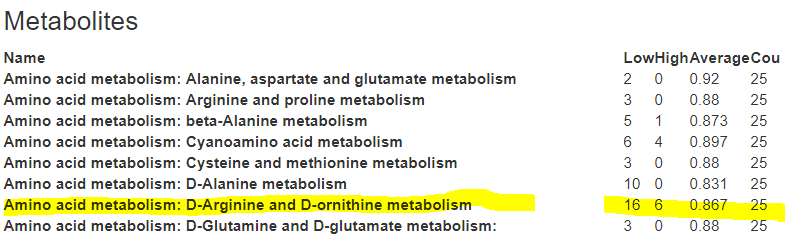
Metabolism Patterns
At present, the number of observations is too low to be able to include a t-score, do the raw numbers only are shown.
Recent Comments