The Microbiome is like a city full for billions of bacteria (people).
- Some items produced in the city are consumed in the city – for example, Bakery products
- Some items are imported into the city – for example, Wheat to make bread
- Some items are exported from the city – for example, factory goods
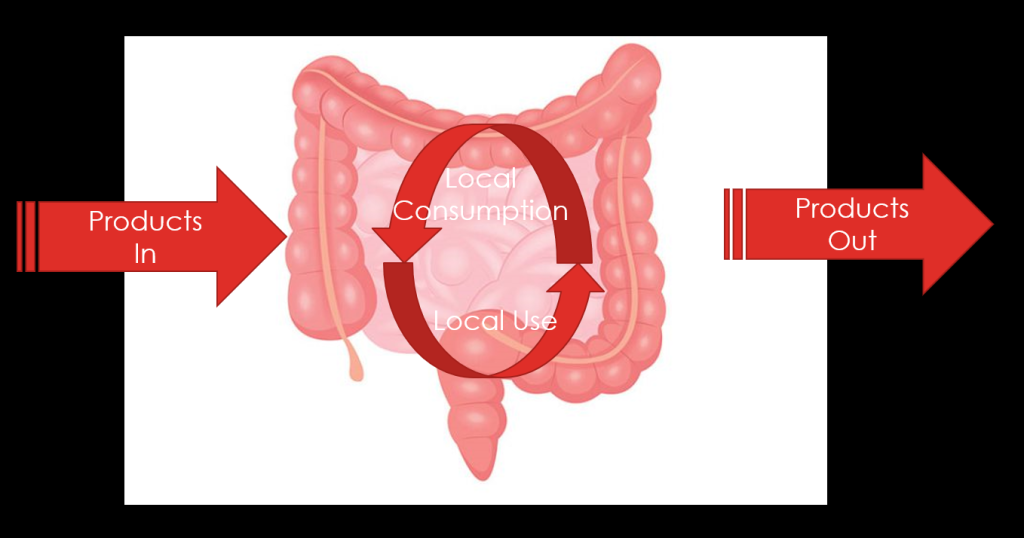
Similarly there are compounds / chemicals in the microbiome. Some imports may be coming from food or cells in the body, products out to be going to cells or into urine, some products are consumed by other bacteria
The intent of this new page is to attempt to get estimates of these flows. These are crude estimates because they depend on two things — the bacteria species identified by the lab (different labs detect different species) and whether the full genes of each species is in KEGG.
The flow is simple as illustrated below
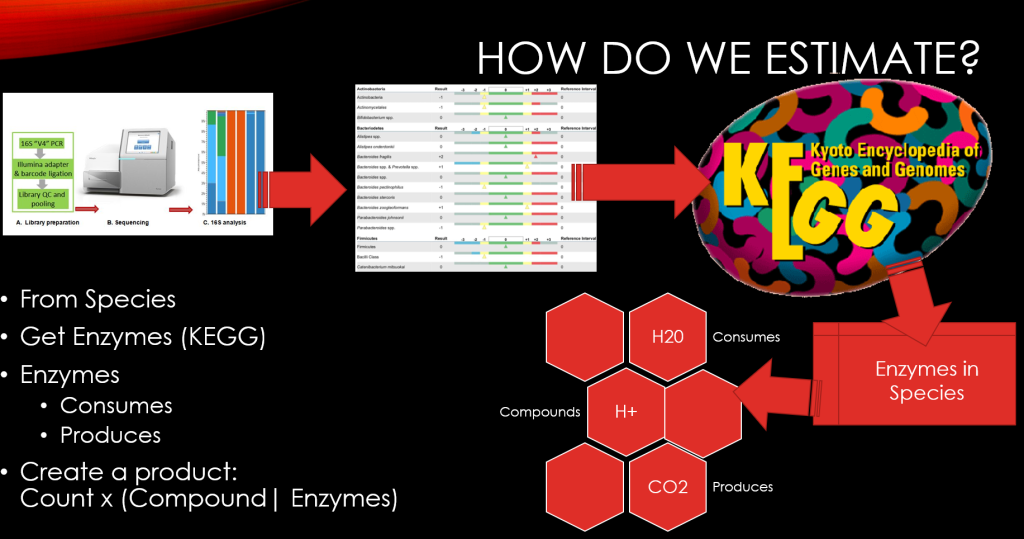
- The Stool sample is sent to a lab
- The lab process it and produces a data file (“Fastq”)
- The lab runs it thru software that produces a list of bacteria and their count
- We then take all of the species reported that are found in KEGG and compute the count of enzymes. We assume one bacteria produces one enzyme.
- From the totals of each enzymes, we go back to KEGG to find what is consumed (Substrate) by the enzyme, and what is produced by the enzymes. Again, we assume 1 unit of compound is produced for 1 unit of enzyme.
- We total all of the compound being produced and consumed.
- We then get the distribution over all samples and compute a percentile value for each.
Needless to say, that is a lot of calculations — a lot!
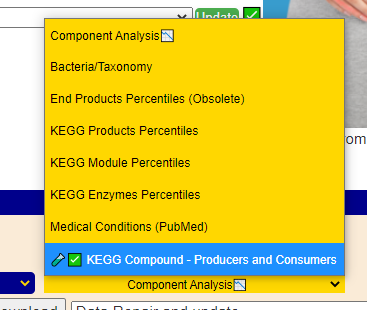
The New Page
The page is under Component Analysis as shown below
When the page for a sample loads, you may be missing the percentiles. This is done because of the amount of calculation involved, it is not done automatically.
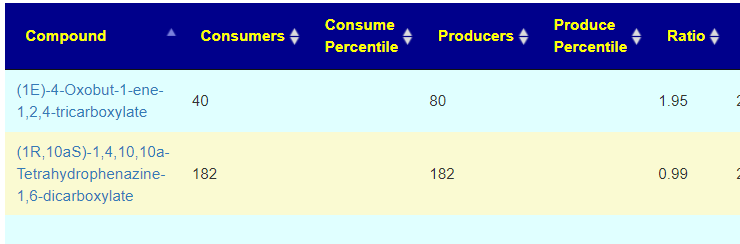
At the top of the page is a button, just click it and wait a little while and the percentiles will appear

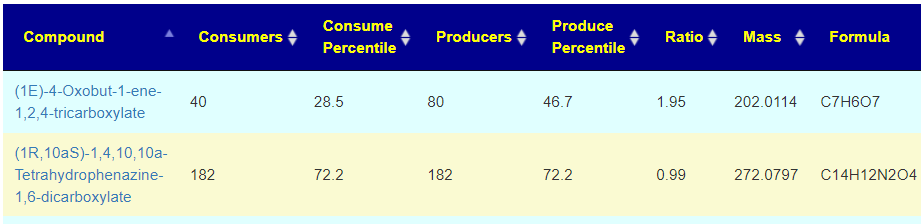
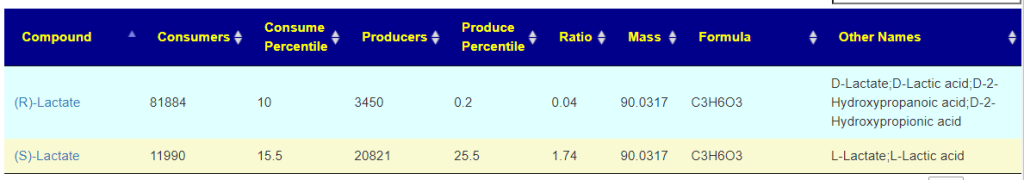
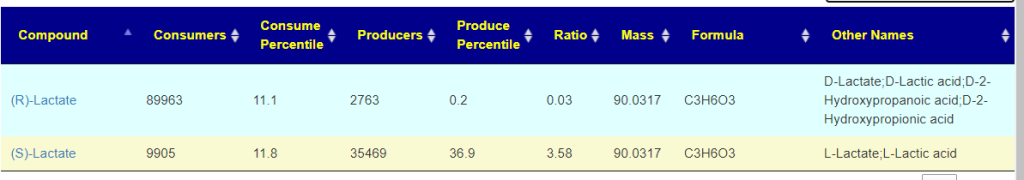
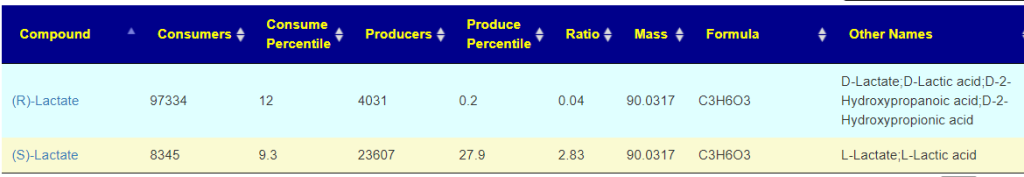
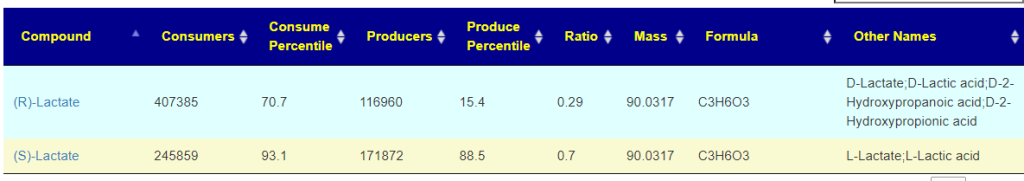
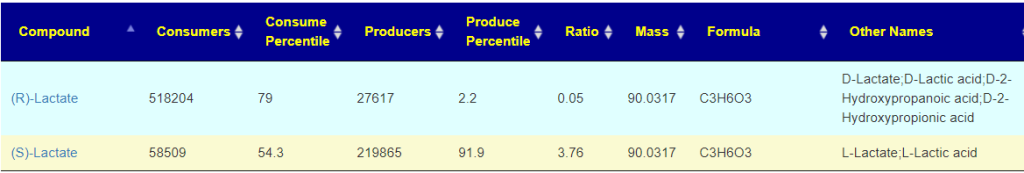
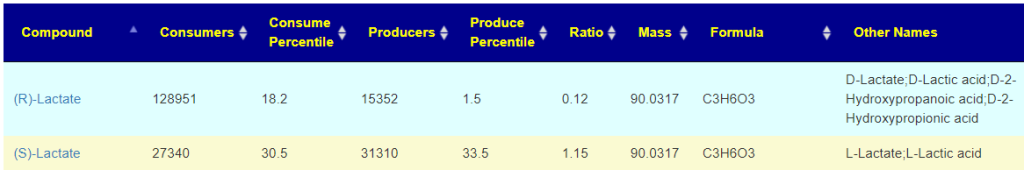
Use the search button to find items that you are interested in, For example, in how much of D-Lactic and L-Lactic acid is being produced and consumed. High D-Lactic acid is associated with brain fog. Remember that comparison must be done with the same lab software identifying.
Bottom Line
This is likely a useful tool for tracking changes between samples. Go to it and add comments when you find interesting things.
Recent Comments