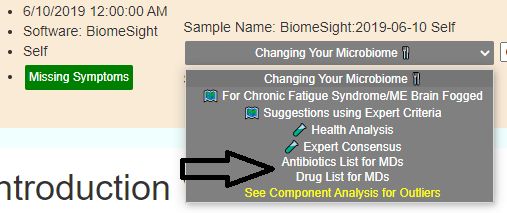
Few medical professionals are aware of the microbiome side-effects of the medications they prescribe. As a result of exchanges with a user about to be prescribed antibiotics based on a positive Lyme test, I created here 2 pages intended for you to share with your Medical Professional.
Where the new pages are located
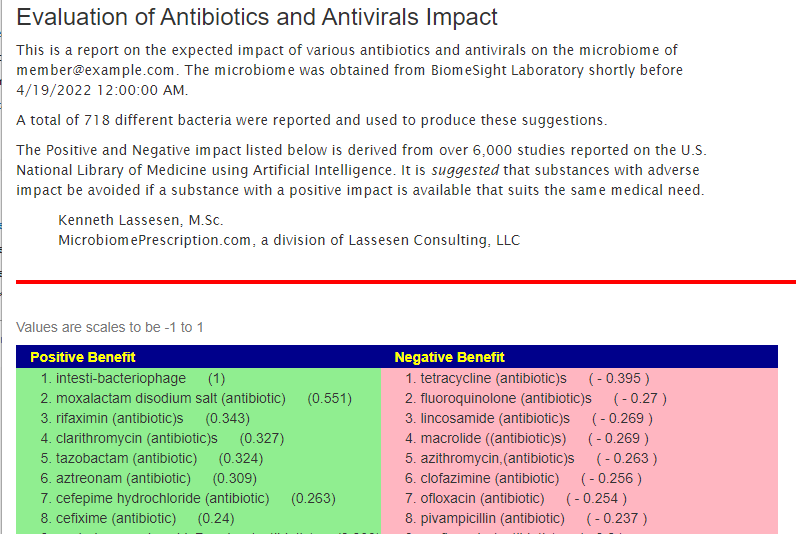
The Antibiotic Page
What the Antibiotics Page looks like.
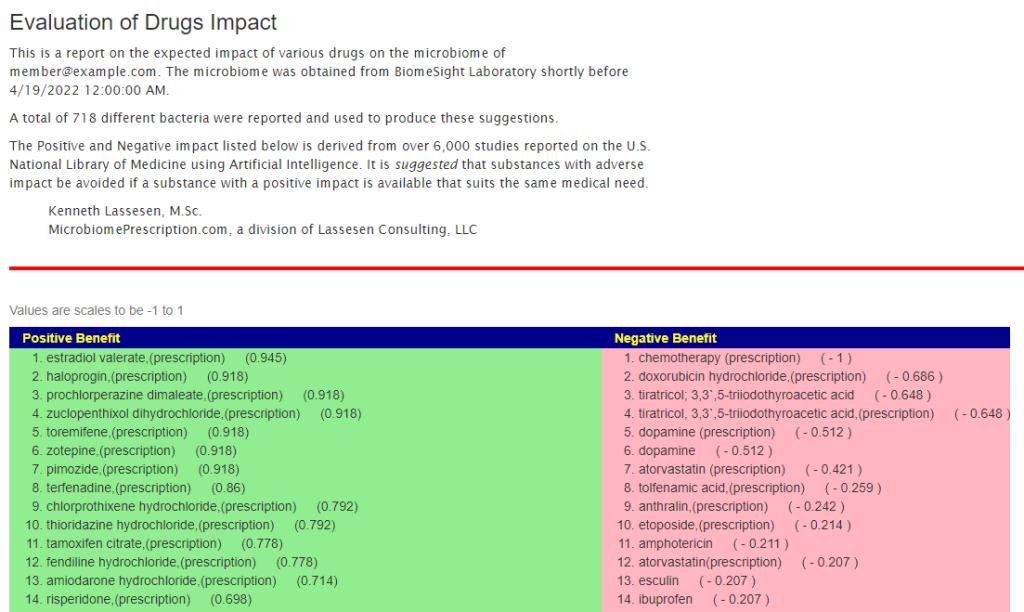
Drugs Page
The list of drugs for which we have available data.
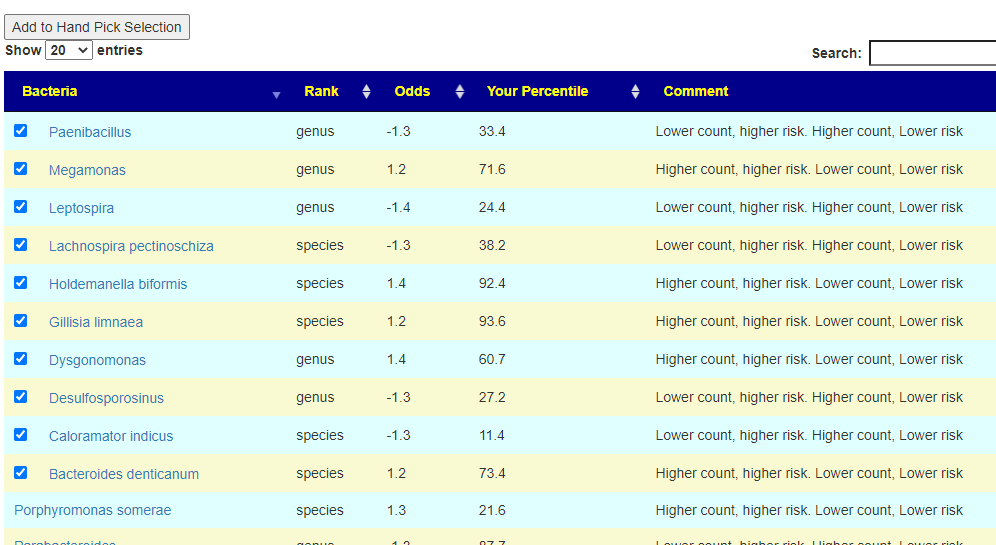
Today I had a long Zoom call with someone that we hope to cooperate with for Long COVID. She mentioned that one species of probiotics works very well for some people with long COVID and it’s sibling do not. I explained that my working hypothesis is that a lot of interactions depends on the enzymes.
This resulted in us doing a quick lookup experiment using Microbiome Prescription databases.
In theory, the 13 items above may be excellent candidates for novel pharmaceuticals to be trialed for treating long COVID.
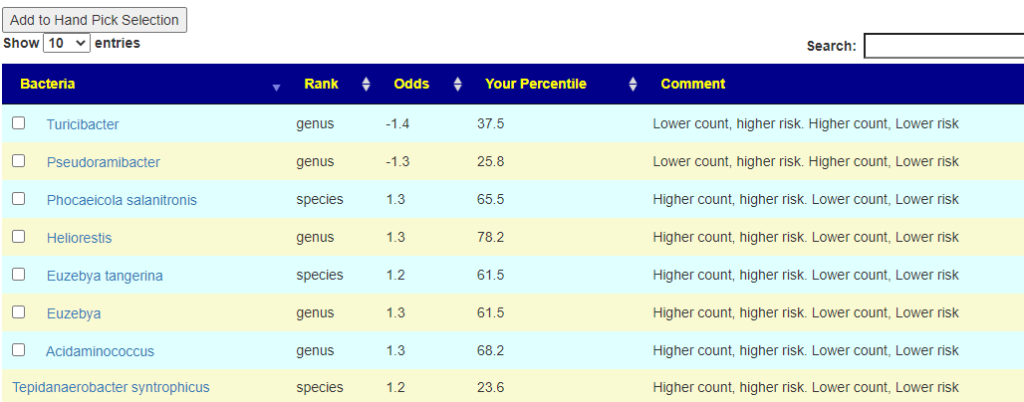
This same approach may be done with other conditions and probiotics. By trials identify which probiotics have the most impact, use the same approach to identify possible enzymes causing the difference, then do a clinical trial.
This blog is using reports from NirvanaBiome for three members of a family. NirvanaBiome use CosmosID for processing.
In this analysis we have people from the same family, implies DNA and inherited microbiome are similar.
A 10 y.o. son who has ASD/ADHD.
Eats various meats, dairy, grains, some beans, and a limited variety of vegetables and fruit.
A 7 y.o. daughter who has been battling constipation for a little over a year now and had some sort of traveler’s diarrhea back in 2017 from which her GI system never seemed to fully recover IMO.
She’s a very picky and self-limited eater. Refuses to eat any meat, but she does consume dairy in the form of yogurt and cheese and ice cream. Most of her diet is some form of processed carb, and the only fruits and vegetables she consumes are in the form of vegetable powders – potato starch based vegetable chips, granola bars with vegetable powder in them, fruit and vegetable powder added to pancakes, etc. She will eat fruit pouches that contain peach, apricot and banana, and she will sometimes eat fresh broccoli, cauliflower, some hummus and red lentil pasta.. She will drink a whey protein drink , and mother adds pea protein powder to things like pancakes as well.
The mother diet is similar to the son’s diet
Analysis
Before getting to suggestions, I want to use the available information to understand better the three microbiome, especially since two are children. Children have a different microbiome than adults. Caution has to be taken with any data of children — we do not know what “normal” is because studies are rarely age specific.
I first look at clustering of bacteria, looking at bacteria in common to all three using percentiles. The number of bacteria that had readings very close to each other was shockingly high, far more than I had expected.
Bacteria Name
Rank
Son
Mother
Daughter
Ruminococcus lactaris
species
92.4
93.7
93.5
Oscillibacter ruminantium
species
81.5
83.6
83.3
Alistipes indistinctus
species
79.5
76.8
80.2
Faecalibacterium
genus
25.4
27.9
29
[Bacteroides] coagulans
species
41.4
44.7
41.1
Hungatella
genus
0.2
4
4
Porphyromonadaceae
family
20.4
16.3
20.8
Adlercreutzia equolifaciens
species
95
98
92.8
Bifidobacterium catenulatum
species
95.4
99.2
93.9
Ruminococcaceae bacterium CC59_002D
strain
88.9
94.4
94.4
Aminicella
genus
90.6
85.4
91.2
Salinispirillum marinum
species
34.2
30.9
37.5
Eubacteriaceae
family
61.8
66.2
58.8
CCUG 54292
species
67.3
59.6
67.3
Eubacterium ruminantium
species
57.8
54.4
62.1
Eubacterium
genus
58.9
63.5
55.8
Burkholderiales
order
18.2
25.9
22.2
Fibrobacteria
class
18.3
26.1
22.5
Bifidobacterium pseudocatenulatum
species
87.2
93.8
86
Coprococcus catus GD/7
strain
37.5
33.3
29.2
Sutterellaceae
family
19
16.3
24.7
Clostridium sp.
species
79.4
76.7
85.2
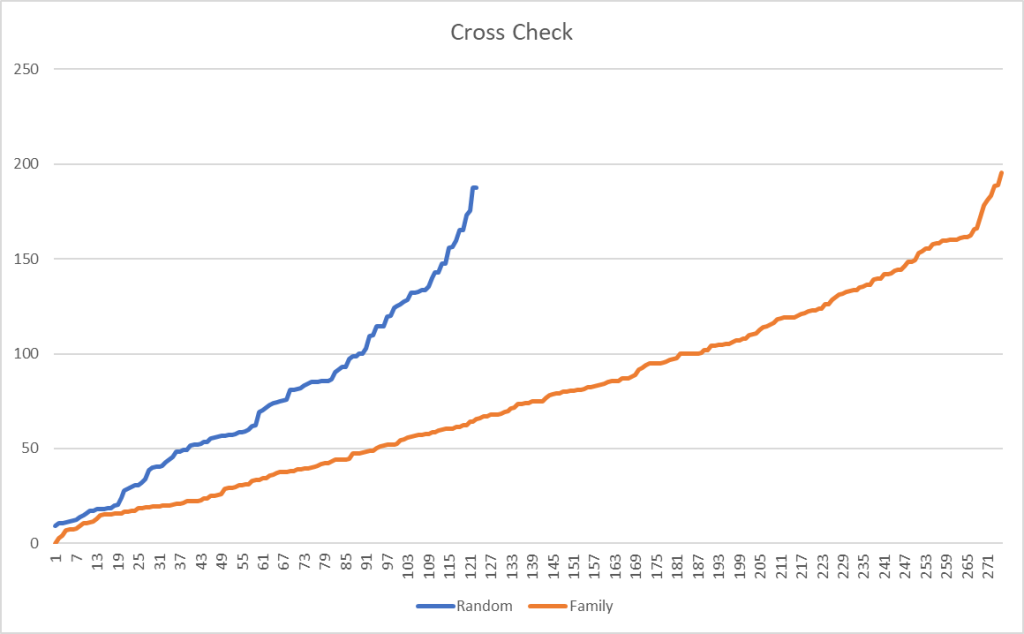
The amount of similarity caused me to want to cross check that this pattern is actually there and not the result of randomness.
Is this “seeing things” in the data or Seeing things?
I grab three other samples from different people who used CosmosId and plotted the difference between bacteria that were share in common. The number of bacteria in common with the family is 2.3x more than a random sample. Remember that many families will be found in almost all samples.
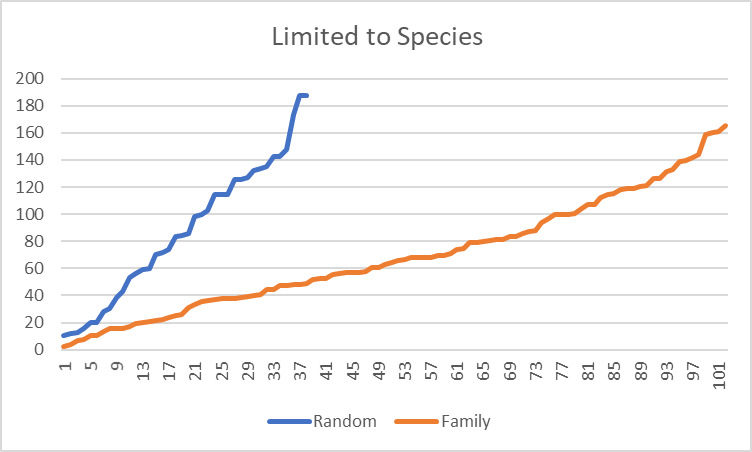
Filtering on species, results in a more dramatic change, with 2.68x more in common. Moving down to strains, it increased further to 3.64x more in common.
The shared diet, living space and DNA clearly results in a “family microbiome” pattern. It would be interesting to do an analysis of some couples that have lived together for at least 10 years (any volunteers?)
We will be using this shared pattern for a customized analysis. It may allow us to better isolated what may be contributing to the two issues cited above (and ignore items that may be high or low compared to the general population)
Identifying Probable Age related items
The microbiome changes with age, and for a number of bacteria we see what appear to be an age based signature.
Given that two are children and one is an adult, we can use how the microbiome changes with age to explain more of the results. The mother is either significantly higher to the levels seen by the kids, or significantly lower.
Bacteria Name
Rank
Son
Mother
Daughter
Rhodocyclaceae
family
0.3
10.8⬆️
3.5
Lactobacillaceae
family
6.4
12.5⬆️
2.4
Fibrobacteres
phylum
5.1
16.3⬆️
7.5
Varibaculum cambriense
species
3.5
16.6⬆️
8.8
Clostridium clostridioforme
species
0
11.3⬆️
3.8
FCB group
clade
8.7
19.2⬆️
4.7
Bacteroidetes/Chlorobi group
clade
8.2
19.1⬆️
4.2
Bacteroidetes
phylum
7.2
18.3⬆️
2.8
Tyzzerella
genus
0.7
17.3⬆️
3
Fusobacterium
genus
3
17.1⬆️
0.5
Bacteroidetes
class
7.3
20.2⬆️
3
Bacteroidales
order
7.3
20.2⬆️
3
Faecalibacterium prausnitzii (Hauduroy et al. 1937) Duncan et al. 2002
species
22
40.1⬆️
21.1
Corynebacteriaceae
family
9.2
21.3⬆️
1.6
Caseobacter
genus
9
21.4⬆️
1.6
Christensenella
genus
69.4
90.3⬆️
68.2
Christensenellaceae
family
66.4
88.9⬆️
65.2
Fibrobacteria
class
18.3
26.1⬆️
22.5
Bacteroides rodentium
species
3.8
28.1⬆️
5.4
Bryantella formatexigens
species
5.4
28.8⬆️
0.7
unclassified Erysipelotrichaceae (miscellaneous)
no rank
28.8
5.8?
34.6
Lachnospira
genus
3.2
30.3⬆️
1
Parabacteroides distasonis CL09T03C24
strain
70
40?
70
Ruminococcus gnavus
species
60.8
30.7?
60.7
Desulfovibrionaceae
family
27.5
58.1⬆️
31.9
Desulfovibrionales
order
27.3
58⬆️
31.8
Phocaeicola
genus
57.6
25.6?
55.3
Eubacterium hallii
species
58.4
90.5⬆️
69.8
Butyrivibrio
genus
9.2
36.9⬆️
4.2
Intestinimonas
genus
26.3
6.4?
46.5
Bilophila
genus
31
71.⬆️1
37.5
Notice how small the difference is between the children in the above list
The kids have two different issues:
ASD/ADHD
Constipation
If there was a third normal child in the same age range, picking bacteria would likely be trivial. What we have are just the difference. We do not know if having higher or lower is the cause of the issue. What we do have are bacteria to research and the mother.
Bacteria Name
Rank
Son
Mother
Daughter
Actinobaculum
genus
84.4
29.9
4.5?
Actinomadura
genus
36.9
26.2
0.1?
Agathobaculum
genus
0.7
1.4
21.7⬆️
Alistipes
genus
77.4
96.9
35.6?
Clostridioides
genus
81.3⬆️
24.4
35.6
Coprobacillus
genus
81.3⬆️
4
0.7
Discomyces
genus
4.8?
93.9
42.5
Dorea
genus
75.3
98.9
20.1?
Eggerthella
genus
95.8⬆️
46
21.7
Erysipelatoclostridium
genus
0.8?
9.4
6.1
Escherichia
genus
32.5?
70.8
61.8
Flavonifractor
genus
0.1?
15.4
20.4
Holdemania
genus
12.1?
17.9
21.5
Intestinibacter
genus
26.8
6
58.3⬆️
Lactobacillus
genus
20.4
29.9
11?
Oscillibacter
genus
44.7
43.5
80.3⬆️
Pseudoflavonifractor
genus
0.3?
47.7
40.8
Roseburia
genus
4.7
28.7
57.7⬆️
Ruminococcus
genus
3.7?
95.4
37.9
Streptococcus
genus
83.3⬆️
69.1
2.6
Subdoligranulum
genus
37.2
47.9
74.2⬆️
Veillonella
genus
0.4?
14.9
9.4
We mark the outliers above — where the values are the same for two
It is important to remember that the studies being referred to, were done on adults usually.
I was curious about Actinomadura because of the differences. It appears to occur in about 3% of samples, hence to get a reasonable sample to get relationships from, a clinical study would need to have 30/3% = 1000 participants and use a 16s processor that detects this bacteria (many do not). Worst yet, because of this rarity, we know of nothing that impacts it.
What to do when there is no information on changing a bacteria!!!
This actually opens the door to using bacteria-to-bacteria associations. We have 111 of them!
Seen when display level is increased.
Looking at one with the highest positive associations, Desulfofarcimen, we see some items that will increase this bacteria (and by increasing that bacteria, Actinomadura should increase): cranberry polyphenols, Goji (berry,juice), walnuts, saccharin. Using all of the 111 interactions, we found only one thing that shows up as increasing Actinomadura (and many things to decrease), choline deficiency (i.e. reduce choline in diet). Items to avoid would be:
jatropha curcas linn. (euphorbiaceae)
nigella sativa seed (black cumin)
oplopanax horridus(Devil’s Club)
hypericin(St. John’s Wort)
kefe cumin (laser trilobum l.)
foeniculum vulgare (Fennel)
lactobacillus bulgaricus (probiotics)
The only likely item would be yogurt containing lactobacillus bulgaricus).
Fortunately, most of the bacteria at the genus level has some studies on them.
Symptom Prediction
This is from binary logistic regression which I have been working on but have not released. I picked the symptoms that appear viable for the reported issues. This is problematic because the regression was trained on adult data and not children — this is a mere exploration
The higher the number, the more likely, the lower the number the less likely.
SYmptomName
Son
Mother
Daughter
Neurological: Short-term memory issues
-1.8
-4.0
-2.5
Neurological: Disorientation
-5.1
-7.2
-6.6
Immune Manifestations: Constipation
0.5
-0.2
1.2
Neurological: High degree of Empathy before onset
-5.6
-45.7
-18.4
Comorbid: Small intestinal bacterial overgrowth (SIBO)
-3.4
1.1
-3.9
Asymptomatic: Live in house with person with probable microbiome dysfunction
-7.2
1.5
-11.2
Neurocognitive: Difficulty paying attention for a long period of time
0.7
0.3
-0.3
Neurocognitive: Can only focus on one thing at a time
0.0
-4.5
-3.6
Autism: Official Diagnosis
-1.8
-3.8
-2.5
Comorbid: Constipation and Explosions (not diarrohea)
0.9
– ∞
1.7
Comorbid: Constipation and Diarrohea (not explosions)
-2.4
0.3
-0.5
The son is the most probable for:
Autism: Official Diagnosis
Neurological: Disorientation
Neurocognitive: Difficulty paying attention for a long period of time (i.e. ADHD)
Neurological: Short-term memory issues
Neurocognitive: Can only focus on one thing at a time
The daughter is the most probable for:
Immune Manifestations: Constipation
Comorbid: Constipation and Explosions (not diarrohea)
The mother is most probable for:
Asymptomatic: Live in house with person with probable microbiome dysfunction
Comorbid: Small intestinal bacterial overgrowth (SIBO)
Comorbid: Constipation and Diarrohea (not explosions)
While we had regression-training issues, using the “in the same microbiome family” comparison approach, the prediction largely modelled the actual symptoms reported.
Suggestions
For Daughter
The daughter is the most challenging — only one match to PubMed studies that matches for constipation. I went to the sample, and made sure these two symptoms were marked. Then I went to the new feature:
The goal is to provide probiotics that supplement enzymes that the person is low in
Next I flip over to data from Clinical Studies, The most studied was Lactobacillus rhamnosus GG (i.e. Culturelle®), followed by my old favorite Mutaflor (Escherichia coli strain Nissle 1917) which has limited availability Mutaflor (Canada, Australia, Finland, Germany) with Symbioflor-2 being a good alternative. Remember this is based on number of studies, not effectiveness.
Last, Ruminococcus is a bit of a challenge because both high and low values are associated in the literature — given the age, I deem it not safe to pursue changes in isolation.
Looking at the heath analysis, everything looks good except for high Escherichia coli and Bacteroides fragilis. I suspect bad E.Coli is a factor for the constipation which suggests that the strong good E.Coli in Symbioflor-2 (or Mutaflor) would be beneficial. Using the various expert opinions (remember those are for adults!) we see 8,25, 76, 141 and 172 bacteria being selected.
Going over to consensus, we see the following items outstanding (and likely path of least resistance to the daughter):
We have a reasonable list of bacteria identified above for Autism and ADHD, so I will run two advance suggestions with 15% selection and US Library of Medicine findings. The results were interesting – there was nothing in common with both sets of suggestions. The top items were:
Now over to the canned expert suggestions, Using the various expert opinions (remember those are for adults!) we see 7,10, 66, 121 and 225 bacteria being selected. With the following being good suggestions:
This is very similar to the daughter and likely reflect the commonality of the microbiome.
The Mother
The meals for the kids are likely good suggestions for the entire family. There are not any active issues with the mother and the commonality of bacteria in all of the microbiome will lead to similar diet. I should mention that alcohol appears on the avoid list (not called out for the kids).
REMINDER
All of these are suggestions coming from mathematical models and not clinical experience. Suggestions should be reviewed by a knowledgeable medical professional before starting.
I am a computer scientist and a statistician. I am not licensed to practice medicine, and where I live has strict laws about ‘appearing to practice medicine’. What I can do for readers is to write a public blog (anonymous) from your data and back story as an education post on using the software and the statistics it produces. I cannot consult. The content should be reviewed by a medical professional before implementing.
This is a follow up to my blog post of Dec 30, 2021. Rosacea, Circulation and mild CFS. The person has tried the suggestions, and now we will attempt to see what the consequences are and the next set of suggestions.
Remember, the suggestions are based on mathematical modelling using clinical studies on study populations, so they may work or not work for individuals.
Reminder: I am a computer scientist and a statistician. I am not licensed to practice medicine, and where I live has strict laws about ‘appearing to practice medicine’. What I can do for readers is to write a public blog (anonymous) from your data and back story as an education post on using the software and the statistics it produces. I cannot consult. The content should be reviewed by a medical professional before implementing.
High Level Measures
Bacteria Reported
Prior: 427
Latest: 591 (38% increase in taxonomy)
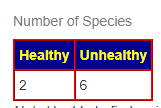
Health Status
Prior: Healthy 1, Unhealthy 8
Latest: Healthy 1, Unhealthy 9
Dr. Jason Hawrelak Recommendations
Prior: 99.7% (effectively excellent!)
Latest: 75.3%. What left ideal is below, nothing moved to ideal
My impression is that the microbiome has become more diverse, in one sense, unstable. The increase in the number of bacteria types reported (591) moved it just above the typical count for BiomeSight (578). My personal experience is that this is a good sign, the microbiome is changing, I experienced this spike is variety before my microbiome settled down into a new, healthier normal.
Symptoms Change
“This things has improved:
Less bloated
Seborrhoeic dermatitis is gone
Better stool
Better libido“
Using the regression for all symptoms we had regressions for, we had 154 improved out of 209 items, or 74% had improvement in the prediction of symptoms.
Overall: Appears to be Improved
This person was a challenge originally because there was no dominate shifts or “smoking guns”. Being at the 99+% for Dr. Jason Hawrelak recommendations and the same items returned from other expert suggestions (many with more criteria) had no significant change. Supporting improvement: Increase in bacteria types closer to typical; significant decrease in number of Unhealthy Bacteria; improved symptoms; and last, prediction of symptoms had a major improvement.
Next Round of Suggestions
After the above sample, he actually started two more items:
10 days with doxycycline
started to take rosemary “Feels pretty good taking it. ”
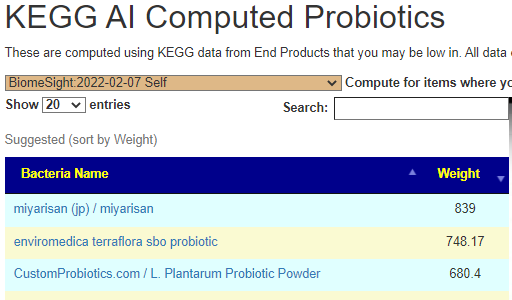
The differences actually shocked me, a very very dramatic difference. On the current sample I see what is often on ME/CFS patients list appear at the top: miyarisan (jp) / miyarisan with also L. Plantarum Probiotic Powder. This suggests that he is moving towards/through a more typical ME/CFS microbiome. Given that he has issues but everything appeared normal or good, I take this as a good sign – we are exposing the issues.
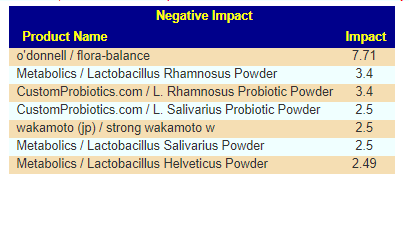
We also have the option of probiotics based on symptoms (adjusted for the microbiome). See Using Samples and Symptoms to Suggest Probiotics post. The data is shown below in decreasing weight order. The nice thing to see is the decrease in the weight of everyone. One totally disappeared (the sole enterococcus faecalis one). It is interesting to note that while above using only the microbiome and resulted in major shifts between samples, when the symptoms are combined the suggestions are very similar and actually reflect improvement of the microbiome.
The person tried using the ME/CFS filter and got very different results. This person has mild ME/CFS; the studies on the US National Library of Medicine are for ME/CFS are typically severe and matches a yard of criteria for inclusion in the study. It is often not safe to use there filters when you self-diagnosis or are mild/controlled.
Adding filtering dropped the bacteria consider by a large amount (up to 92%!!).
My usual criteria has been to have at least 1-2 dozen bacteria. With the new consensus report, having a large number of bacteria seems to produce clearer results.
Bottom Line
Suggestions to be discussed with their medical probiotics
We saw improvements between the sample when this reader implemented some of the suggestions. Remember, the suggestions improves the odds, they do not guarantee nor is there any requirement or protocol to follow.
Follow up Comments from the person
Watched the video you uploaded – it was great to get a video and watch how you did for my test. Quercetin and resveratrol seems to be something to avoid when I did it your way – so I will cut that out.
High red meat and high beef diet seems to be something to avoid (felt it myself also).Been cutting out all red meat for some days now – feels pretty good. One thing to avoid is also “vegetable/fruit juice-based diets”. I drink like 1-1,5 liter juice a day. I will try to reduce it but it’s really hard – do not feel good eating to much meat, fat or starch. So when cutting out juice I do not get enough calories. Calories are really important to me – which I also see now on my avoid-list – “low energy diet/ calorie restriction” is on it. One other thing that is interesting is that potatoes is on the “Highest Adverse Risk”-list. I eat potatoes every day.
I extracted out the items that are recurring as good predictors for various symptoms. These are listed below. This is intended for those interested in research and diving deep. See AI Computed Probiotics from Symptoms for background.
I extracted out the items that are recurring as predictors for various symptoms. These are listed below. This is intended for those interested in research and diving deep. See AI Computed Probiotics from Symptoms for background
I extracted out the items that are recurring as predictors for various symptoms. These are listed below. This is intended for those interested in research and diving deep. See AI Computed Probiotics from Symptoms for background.
preQ1 synthase;YkvM;QueF;preQ0 reductase;preQ0 oxidoreductase;7-cyano-7-deazaguanine reductase;queuine synthase (incorrect as queuine is not the product);queuine:NADP+ oxidoreductase (incorrect as queuine is not the product)
reduced flavodoxin:(R)-2-hydroxyacyl-CoA dehydratase electron transferase (ATP-hydrolyzing)
6.1.1.1
tyrosine—tRNA ligase
L-tyrosine:tRNATyr ligase (AMP-forming)
6.2.1.1
acetate—CoA ligase;acetyl-CoA synthetase;acetyl activating enzyme;acetate thiokinase;acyl-activating enzyme;acetyl coenzyme A synthetase;acetic thiokinase;acetyl CoA ligase;acetyl CoA synthase;acetyl-coenzyme A synthase;short chain fatty acyl-CoA synthetase;short-chain acyl-coenzyme A synthetase;ACS
magnesium chelatase;protoporphyrin IX magnesium-chelatase;protoporphyrin IX Mg-chelatase;magnesium-protoporphyrin IX chelatase;magnesium-protoporphyrin chelatase;magnesium-chelatase;Mg-chelatase;Mg-protoporphyrin IX magnesio-lyase
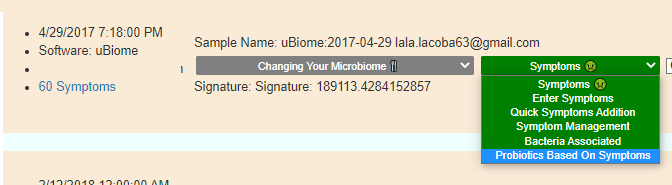
In this post, AI Computed Probiotics from Symptoms, we could calculate probiotics that could help for one symptom at a time for the general population. This is nice if you have just one symptoms and no microbiome details. See Ways of Choosing Probiotics for an overview on picking probiotics.
We can do better, a new page is up that will allow us to calculate the probiotics based on multiple symptoms PLUS your microbiome sample! In other words using all available information. (I will not create a page to handle multiple symptoms with no sample — you need to get a sample).
Where the page is located on the menus
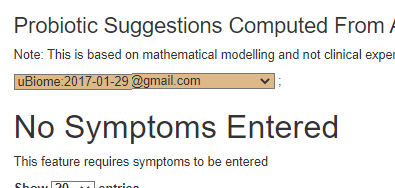
You must have entered symptoms for this to work. If not, you will see this appearing
After you enter symptoms, a page may appear like below
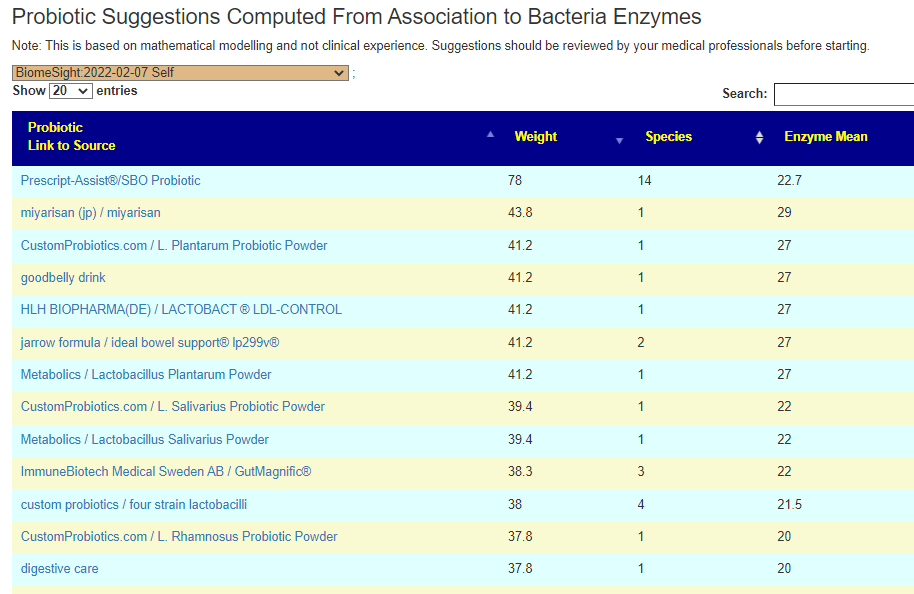
Example of suggestions
I should emphasis a few things:
This is by retail probiotic name.
The probiotic must be available somewhere in the world. It may not be available where you live
If you wish to know which species are in the probiotic, just click the name.
Probiotics with the same numbers are likely the same species (i.e. no difference)
The Weight is an estimate of how much of the missing enzyme it will provide (weight is based on odds)
Enzyme Means is the number of Enzymes that will be provided by it
Species is the number of different species in it.
Practical Example
Using the above example, the person founds that Prescript-Assist®/SBO Probiotic is either not available or too expensive (watch costs!) and proceeded down the list:
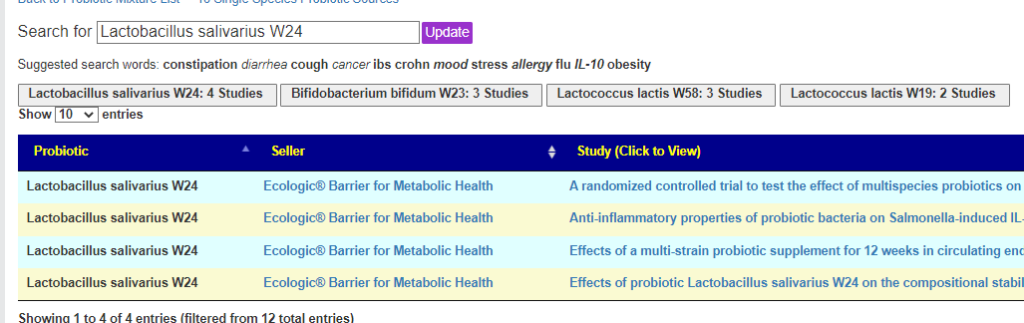
Next, they work down the list to find something that contains neither of the above (different strains, different enzymes)… the winning bacteria is: lactobacillus salivarius
Using the KEGG based calculation without using symptoms:
Where the suggestions without symptoms being taken into account is located here. REMEMBER to raise your display level to see this linkFor the same sample as above, we have 2 of the three top suggestions being the same!
The third way is by suggestions — here, the choice of bacteria selection can result in a wide variation of probiotics suggested and contradictory results as shown below:
To take or not to take should be done on consensus (i.e. ideally 3 says to take). Of the above methods, the one with the weakest quality of data is from suggestions (because it is so dependent on studies being done! ). For the one in conflict, lactobacillus salivarius (AKA Ligilactobacillus salivarius), there were studies found in the above link (strain specific for retail probiotics), NOTE: I missed them on the first pass because I did not enter the name in “Search for” and had left the default ‘constipation’ there
One of the symptoms was brain fog and depression. “sad mood” is a sufficient match.
To translate the methods into human “detective” terms
KEGG — DNA is a match
KEGG + microbiome Sample — DNA and video is a match
Researched Studies — Profiling by race, sex, age etc is a match (studies are done on populations, not individuals) – it is truly “bacteria profiling”
Suggestions based on bacteria picked — close to setting up police stops to detect drunk drivers. The number of people arrested depends on time, location etc of where the stops are done.
I am a computer scientist and a statistician. I am not licensed to practice medicine, and where I live has strict laws about ‘appearing to practice medicine’. What I can do for readers is to write a public blog (anonymous) from your data and back story as an education post on using the software and the statistics it produces. I cannot consult. The content should be reviewed by a medical professional before implementing.
Video walkthru of this blog
Back Story
35yr old, female with ME of around 15 years, Coeliac and Crohn’s diagnosed in 2014 plus simple temporal lobe seizures and endometriosis.
I have tested extremely extensively and most labs are generally normal with the exception of:
Prolactin- always slightly above high end of range
Lyme ELISA IgM positive but Blot negative (possibly cross-reactive with RF)
Rheumatoid factor – one point over upper range
LDH – consistently slightly above range
Aldolase – tested once, slightly above range
ALT – occasionally slightly above range
EBV – positive for past infection but never any evidence of reactivation
SIBO breath test positive for hydrogen only
I am really struggling with acne… I have been offered Lymecycline for the acne but don’t know if it’s worth the risk. I am currently on a 7-day course of Co-amoxiclav (amoxicillin + clavulanic acid) for an infected cyst (my Biome sample was taken before this).
I was able to control my crohn’s with an elemental diet, followed by strict paleo, then gradually reverting to a more relaxed diet. I did a course of oregano oil which was very harsh on the gut but it got rid of my constant bloating for the first time in my life (this came back and remains since reintroducing carbs). I’m 99.9% sure I’m on the autism spectrum. Interestingly, some of my autistic traits and my ME symptoms abate somewhat for a short period at the beginning of a cold virus (the first couple of days while fever is present). I had a similar temporary reaction to Sulforaphane.
My ME started while I was working full time, following glandular fever in 2006. The onset was characterised by ‘tired but wired’ and rolling PEM, finding it almost impossible to fall asleep until it was nearly time to get up and a complete inability to get into deep sleep. I reduced my working hours gradually but eventually gave up work fully in 2008. Even when ‘healthy’ I never had normal stamina, muscle mass and was really ready for bed by the end of the work day.
Possibly coinciding with my gastrointestinal diagnoses and subsequent avoidance of gluten, my symptoms calmed a bit from the ‘acute’ years, and I began to sleep a little better and get brief symptom-free interludes while at rest. Now, prolonged activity above baseline will lead to a return of the PEM and ‘tired but wired’ symptoms (inability to switch off nonsensical chattering thoughts at night leading to insomnia, feeling hot with chills, feverish, sweats, tossing and turning all night. These symptoms stop on rising but leave me extremely brain fogged from the sleep deprivation, and then repeat the next night. I also experience myalgia, headaches, orthostatic intolerance and strong need to lay horizontal throughout the day. I wake with heavy puffy face and eyelids most days. I go through periods of extreme dry mouth, worse on waking despite always hydrating well.
Even in my symptom-free-at-rest periods, I still struggle to get to sleep some nights, although I keep a strict routine 10pm-10am. I find it very difficult to get into the deeper stages of sleep almost all of the time. Even with all reasonable interventions and ear plugs I am easily startled awake by household sounds and there is usually activity from others from 4-5am onwards.
Microbiome Analysis
I am going to do three levels of Analysis. I will start with generic, then move on to diagnosis using US National Library of Medicine studies and ending with the latest refactor, using bacteria associated with symptoms discovered from uploads to this site. The purpose of these analysis to get suggestions for the most probable bacteria causing issues.
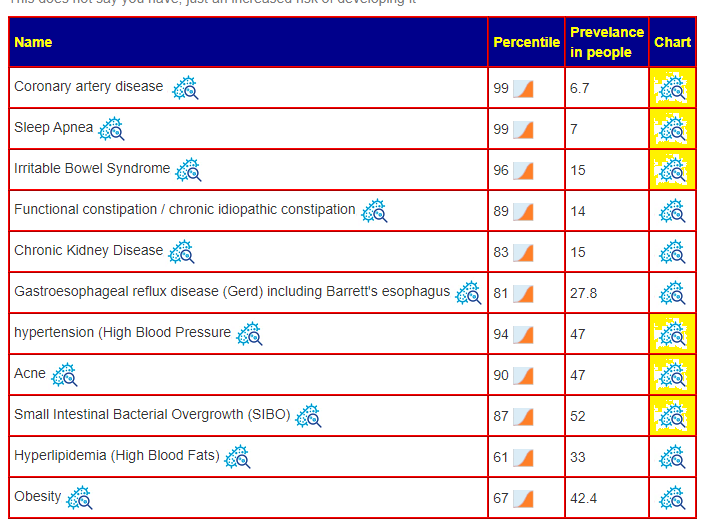
Overall Health
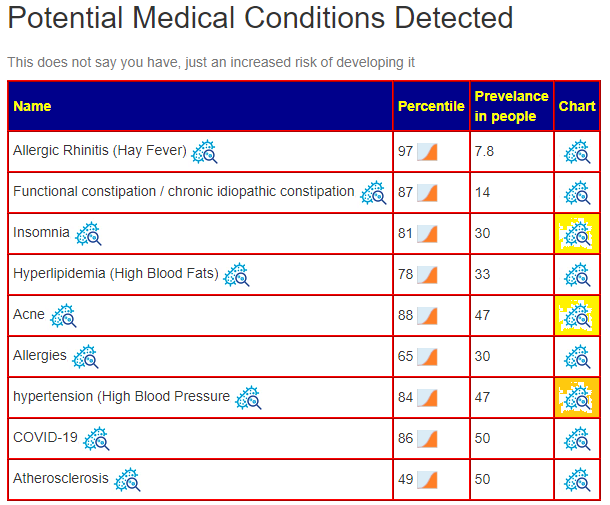
A domination of unhealthy bacteriaME/CFS patients tend to have low blood pressure, do ignore hypertension. Acne and Insomnia are reported symptoms — so we have the microbiome matching the conditions. See Q&A for more information.
I will not go step by step (see this post with video for how to do this) but do the following suggestion generation and then look at the consensus
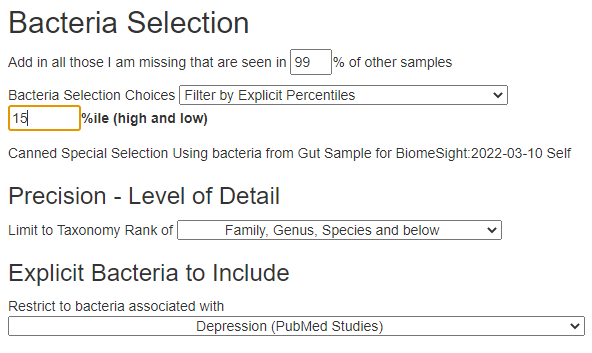
Then I went to Advance Suggestion with Percentile: 15% and the following PubMed conditions (Remember that Display Level must be Intermediate or higher to see this option):
Acne – 3 bacteria
Crohn’s Disease – 24 bacteria
Celiac Disease – 14 bacteria
Chronic Fatigue Syndrome – 13 bacteria
Then I went to Symptom Associated to Bacteria (Citizen Science) and found the following applicable items:
folic acid,(supplement Vitamin B9) – often I see that B-Vitamins are split between take and avoid, this suggests that B-Complex capsules may not be the best choice.
Both D-Ribose and Magnesium are well studied supplements in a ME/CFS context (confirming predictions to clinical practice the items are linked to CFSRemission Blog).
Bottom Line
At this point I will stop for several reasons:
Purpose was to show the method
Person has brain fog often, so more notes may be counter productive
ME/CFS usually have restricted funds, so keeping the number of items low reduces frustrations over not being able to acquire.
A video will be added in the next few days
Questions And Answers
Q: I forgot to mention it, but I do have allergic rhinitis and high cholesterol (as listed under the detected conditions) so this is very accurate.
A: Although I see this often, it keeps surprising me about the accuracy of predictions!
Q: Interesting that it doesn’t pick up on any CFS-related bacteria at a species level, I wonder if this fluctuates and could possibly be because I was relatively low-symptom at the time of the sample, i.e. not in a PEM flare?
A: You are very likely correct, it does fluctuates. Also, keep in mind that there are many subsets of ME/CFS, so this can be a little hit-and-miss.
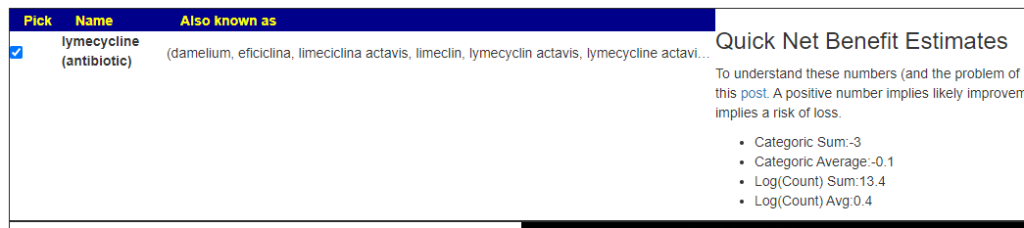
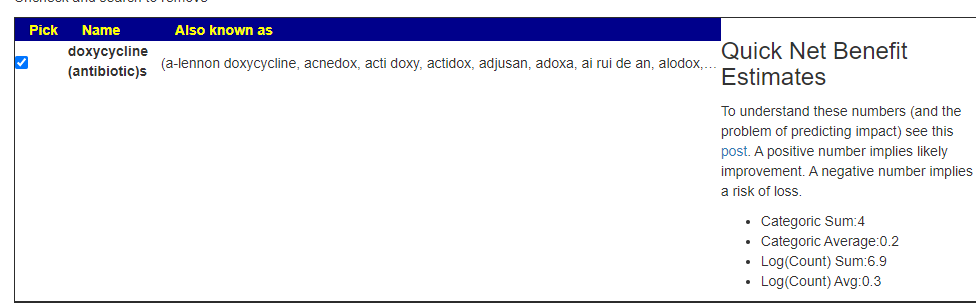
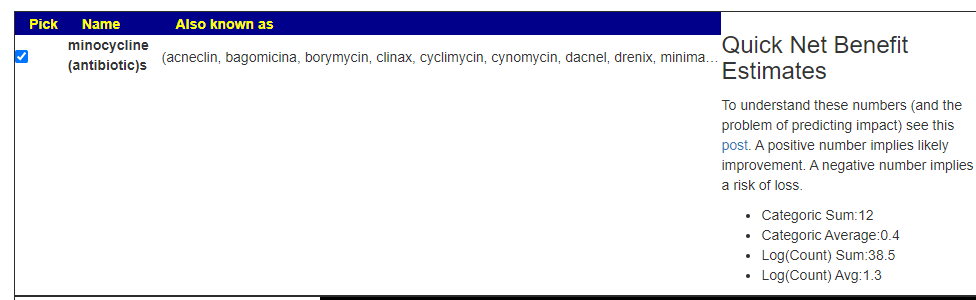
Should I take Lymecycline?
A: This is a little complex, we have mixed results.
But when I tried a different antibiotic often prescribed for acne, it is all positive
And my favorite because it reduce inflammation and crosses the blood-brain barrier:
I would suggest making a counter proposal to your medical professional of minocycline instead.
Q: I’d be interested in your opinion on IgY hyperimmune egg powder supplements for targeting gut pathogens
A: There are many retail products like this. What I found are some vet studies[36 listed here]. I found a list of clinical studies here. My general impression is that it is favorable. There is one word of caution, it appears similar to transfer factor — i.e. the IgY may be targeted to specific bacteria/infections only. Hence, my advice would be to buy just one unit of it, if no response, change to a different brand when you finish it. Remember my motto: Rotate, rotate, rotate….
“Oral immunotherapy using egg yolk polyclonal IgYs against Eimeria sp. represents an effective and natural resource against severe E. tenella infection favoring the gradual withdrawal of the anticoccidial drugs and antibiotics.” [2021]
I am a computer scientist and a statistician. I am not licensed to practice medicine, and where I live has strict laws about ‘appearing to practice medicine’. What I can do for readers is to write a public blog (anonymous) from your data and back story as an education post on using the software and the statistics it produces. I cannot consult. The content should be reviewed by a medical professional before implementing.
Back Story
Male, 57, very high pain tolerance, little tolerance of irritation (itch, slivers, paper cuts, cold, drafts)
Diagnosed with Fibromyalgia at age 35
Proposed diagnosis of Psoriatic Arthritis last year
Psoriasis (or eczema since 10 yrs old). Usually cold hands and feet.
Depression most of my life.
Currently abated by Bupropion, past included: Serzone, Gabapentin,Lyrica
Always loose bowel movements, but not diarrhea. Never constipated.
Musculoskeletal pain all my life. Not worse with activity.
Restless leg syndrome while sitting, Had to shift every thirty seconds.
Took pamiprexole for 4 mos. Stopped PPX, restless leg never returned.
Felt sick with Aspartame. (Phenylalanine)
About 20 years ago, with the intention of it being an elimination diet, lived on nothing but boiled eggs and (Chinese dish) Beef & Broccoli (with GF soy sauce, sesame oil, garlic, ginger and olive oil). Swallowed Tbsp of turmeric daily.
After 7 months, complete remission.
Lapsed diet, Remission lasted 4 mos. Woke up one morning fully sick.
Went on a gluten free, seed free, seed oil free, ketogenic diet about 10 years ago. I suspect the lack of carbs starved a Candida problem. Much reduced symptoms for about 8 years, downhill slide the last two.
Taken arthritis-related herbs the last year. Researching each, (about a hundred researched, perhaps 15 taken) they all seem to benefit the microbiome.
My kidney and liver labs are very good. My heart scan showed zero plaque deposits.
I am going to do three levels of Analysis. I will start with generic, then move on to diagnosis using US National Library of Medicine studies and ending with the latest refactor, using bacteria associated with symptoms discovered from uploads to this site. The purpose of these analysis to get suggestions for the most probable bacteria causing issues
Generic Analysis – Pass #1
This is the suggested path for a first time user to take. We are not targeting for specific issues, rather trying to improve the microbiome towards a typical microbiome. For many people that is sufficient
With the large number of medical issues described above I started by looking at potential medical conditions using National Library of Medicine data. One of the challenges is that the microbiome profiles are often based on naïve patients (i.e. not being treated for anything), he is being treated.
Yellow items are significant risk [i.e. Percentile Greater than (100-prevalence/2) ]
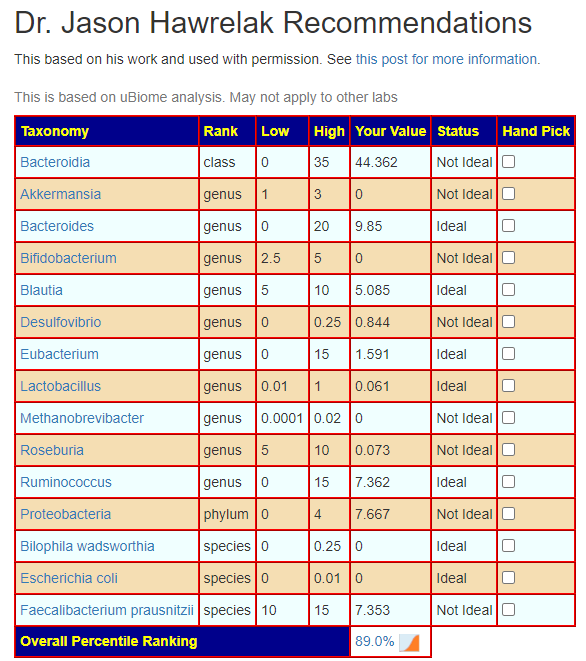
Going further down the page, we see that your microbiome does not have major dysfunction by Dr. Hawrelak criteria (89%ile)
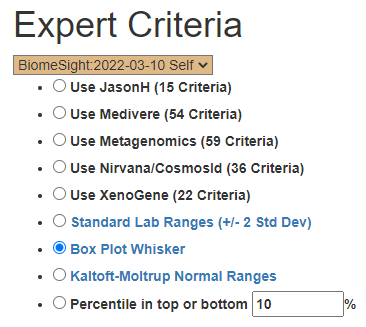
I proceeded to the Expert Criteria page and did each option. I then use the consensus report to identify the best candidates.
The first ones (Use…) all just picked 8 bacteria. Standard Lab Ranges picked 12 bacteria, Box Plot: 55, Kaltoft-Moltrup : 73 and Top/Bottom at 10%: 70. As a reminder, the consensus button appears after doing two suggestions sets in 24 hours. An alternative (since the first 5 picked the same bacteria) is to do just one of the “Use” and each of the others, then look at the consensus (left as an exercise to the reader).
Consensus data is kept for 24 hours only, or when a user clear them
I noted that some of his past diet types are on the Adverse Risk list, i.e. those choices may have contributed to where he is now (not immediate, but keeping to them long term).
National Library of Medicine Conditions – Pass #2
For this pass, we clear our consensus suggestion. We want the suggestions to be specific.
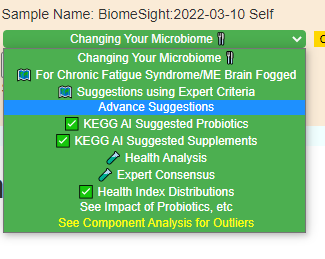
How to clear consensus suggestions so we can build a new set.We then go to Advance Suggestions.
Since this person has been taking a variety of prescription drugs, I am including that in suggestions. The main reason is to see if there are alternative prescriptions possible that may be more microbiome beneficial. For ME/CFS, often the top items with this choice have been antibiotics that have been used successfully for treating ME/CFS (despite the AI not having that information).
First, we need to determine the conditions that we have data available for and that this reader has. I extracted these as candidates:
Depression ? – resulted in 16 bacteria picked, only one prescription drug, etoposide a cancer drug
quercetin followed by a long list of prescription drugs
I will skip the avoid list, they should be reviewed by the reader. What is interesting to note was that both antihistamine and antifungal drugs showed up based on the bacteria patterns. This suggests that those two issues may warrant investigation.
P.S. I picked 15% arbitrarily, I like to shoot for an average of 6-10 bacteria per set of suggestions being selected to keep the suggestions focused. You may wish to increase or decrease to tune the number selected.
Using Symptoms – Pass #3
This comes out of this weeks refactor. A video of this feature is below (TO DO).
Again, clear the consensus as we did above. Why, because we will likely be running several list of suggestions.
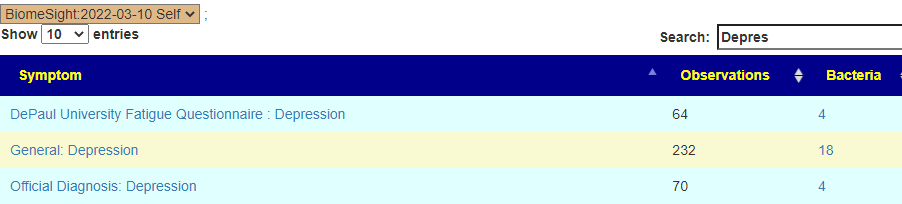
Where this new feature landed (the name may change a little). Clicking on the link and then entering “Depression” will give you a few choices.I went with the General Depression — sample size was bigger than the others, and thus the bacteria identified was more.
On the resulting page, you will see checkboxes to pick the bacteria that are likely good candidates to change. I went and checked all of them and then clicked the [Add to Hand Pick Selection] button at the top.
I then checked Fibromyalgia and had no luck (we have a small number of people with this condition, so detection is poor).
Again, I checked all of the available checkboxes and click to Hand Pick Selection. Then I went to Comorbid: Restless Leg which had only one bacteria with a checkbox.
At this point, I notice that a Hand Picked Bacteria button appears on my samples page
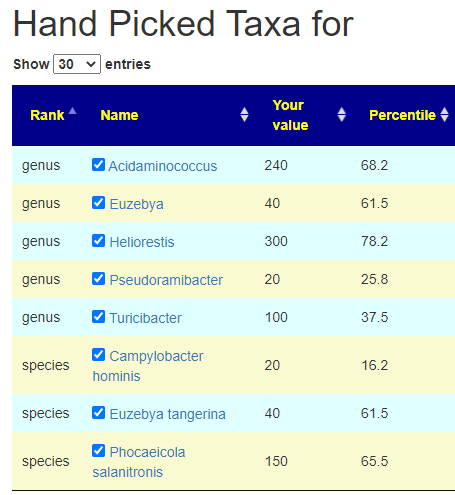
First view what was selected. We have a total of 8 bacteria, sufficient (I hope).
We then pick the suggestions link on the same drop down. Again pick all modifiers.
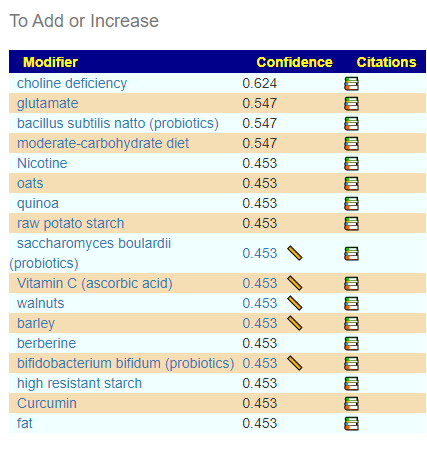
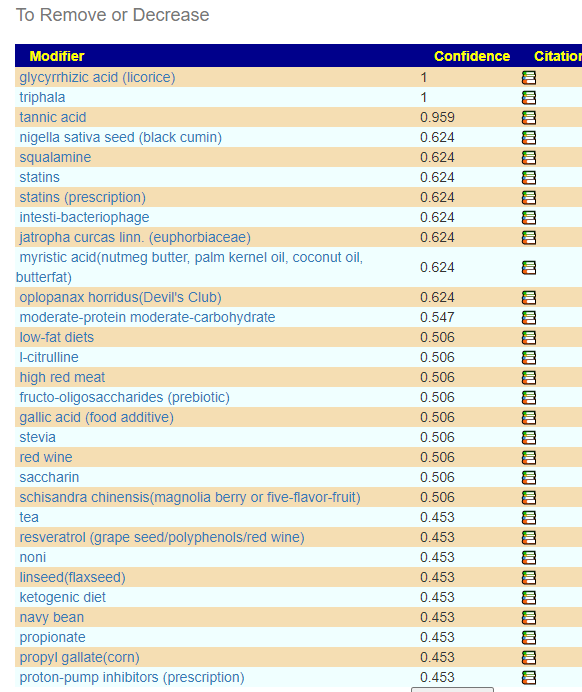
The list is similar to the early ones. Choline Deficiency means reduce choline intake.The avoid list — many of the items were seen on the avoid lists above. For a few items we have disagreement, but for most, agreement.
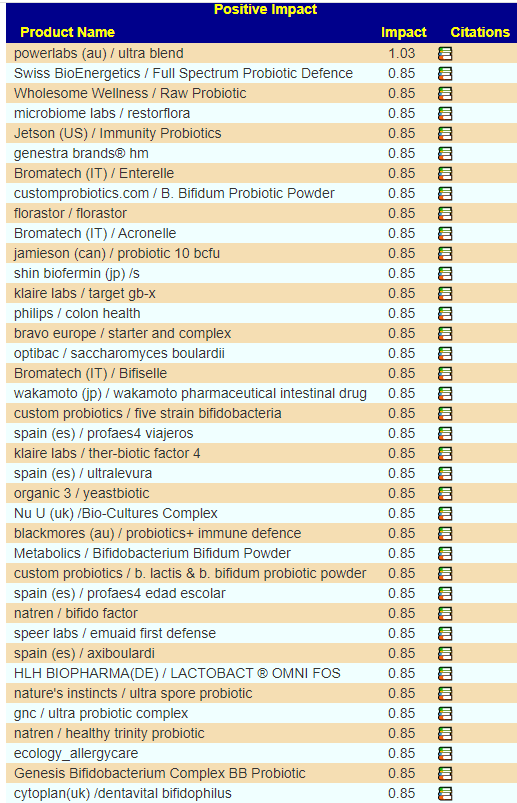
For retail probiotics, we have long list with most having similar benefit
Note why the values are the same, many have nothing in common
Personally, I would likely drop these into rotation (there are no bacteria common to any of them):
wakamoto (jp) / wakamoto pharmaceutical intestinal drug
customprobiotics.com / B. Bifidum Probiotic Powder
shin biofermin (jp) /s
optibac / saccharomyces boulardii
Bottom Line
Above we saw three different approaches to obtaining suggestions. There was agreement between each of the approaches for over 70% of the items. My usual suggestion to discuss with your MD before starting:
Take 2 of the following probiotics for two weeks and then rotate to a different pair
wakamoto (jp) / wakamoto pharmaceutical intestinal drug
customprobiotics.com / B. Bifidum Probiotic Powder


Recent Comments