Based on several online meeting that I had, I thought a series of online meeting for people to ask questions, be shown features, etc would benefit many. All meetings were recorded and then posted on YouTube. After viewing these, you may wish to view this from Jan 2023 also.
The second in a series of online sessions. Shows how dosages are determined from EXISTING studies and shows how just one suggestion may be based on over 20 different studies (with working links to the studies). This is several magnitude better than ANY microbiome testing company suggestions
One link was broken in the demo. It is now fixed and a walk through is done below.
A reader message me and sent over two files. One was familiar and my advise has been to transcribe the data; the other was a new format and it was very possible to code an uploader for in less than a day.
The small one, bacteria-count is what can be uploaded.
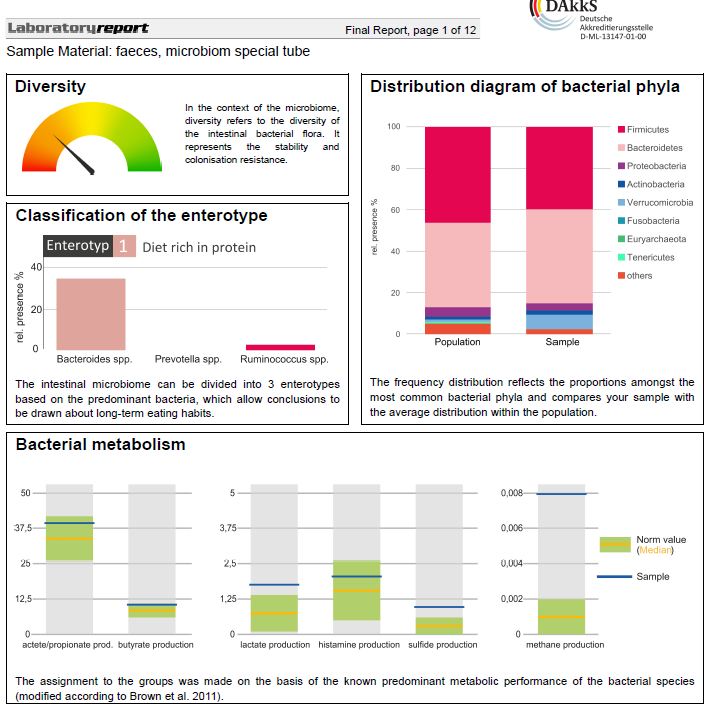
The analysis one has less taxonomy data than the bacteria count one and starts up with the type of page shown below. Dissecting it to get the data would likely be six full man-weeks of development. My attitude is for clients to hassle the provider to make a more friendly format (i.e. tab or comma delimited text files).
The Sweet Bacteria Count File
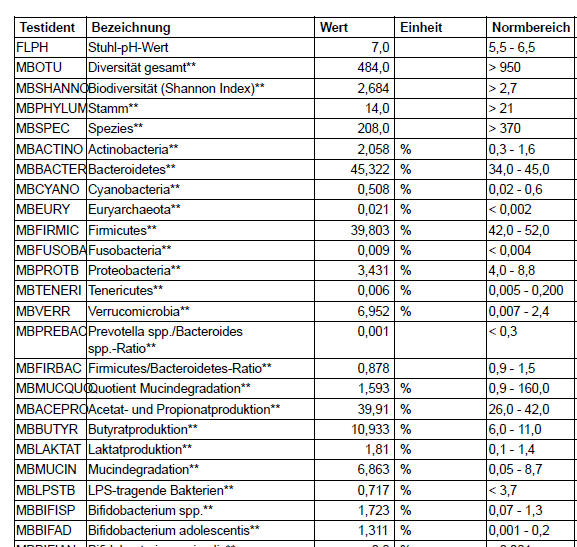
This file looks like below and is relatively easy to extract the data for (i.e. less than one developer day).
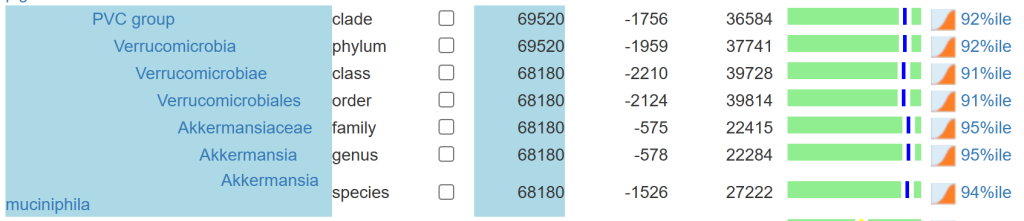
We have only a hundred bacteria at different levels reported. If you go to the microbiome tree, you will see a lot more! Why, we build all of the missing levels of the bacteria hierarchy from the missing data. The upload has no family, order or class information … so we make a best effort attempt to estimate them.
We also apply percentile based on all samples uploaded (until we get 200 samples for a specific test) … again best efforts. See The taxonomy nightmare before Christmas… for background.
For more information on this project see Health Rising post. Both participants has granted me to do a review with their real names. This is the second of a series of posts on this project, the first one was on The Remission Biome Project: Tess Falor.
The earliest use of antibiotics for treating ME/CFS that I am aware of, dates from the late 1990’s with articles in Journal of Chronic Fatigue Syndrome (and conference reports prior)
My remission from ME/CFS was done by combining C.L. Jadin protocol with Dave Berg anticoagulant protocol.
A big thanks to BiomeSight.com for donating some testing kits to the project. If interested in using their kits, there is a discount code (“micro”).
Overview of results
First, let us show the numbers and then talk about them. It is clear that there are significant changes. There are a lot of dimensions to consider. Some highlights:
The number of bacteria with abnormally high representation has gone from 123 down to 29
The number of bacteria with abnormally low representation has gone from 222, dropping down to as low as 19, before rebounding to 162 (still better than the start)
Most measure showed great improvement and then some relapse.
Criteria
7-Mar
23-Mar
15-Apr
22-Apr
29-Apr
Shannon Diversity Index
33.8
78.0
97.1
76.5
77.1
Simpson Diversity Index
0.7
65.1
58.6
60.3
73.4
Chao1 Index
91.3
61.6
72.0
89.4
14.8
Chi-Square (Lower is better)
55
47
46
50
30
Lab Read Quality
8.6
7.1
5.4
2.2
6.9
Bacteria Reported By Lab
755
638
628
765
461
Bacteria Over 99%ile
27
11
13
56
5
Bacteria Over 95%ile
72
25
30
105
18
Bacteria Over 90%ile
132
46
63
178
29
Bacteria Under 10%ile
222
218
62
19
162
Bacteria Under 5%ile
191
195
18
12
144
Bacteria Under 1%ile
177
179
0
3
112
Lab: BiomeSight
Rarely Seen 1%
8
4
3
66
2
Rarely Seen 5%
22
24
27
128
14
Pathogens
39
32
33
31
29
Outside Range from JasonH
8
8
8
8
8
Outside Range from Medivere
18
18
16
16
16
Outside Range from Metagenomics
9
9
6
6
6
Outside Range from MyBioma
10
10
6
6
6
Outside Range from Nirvana/CosmosId
18
18
12
12
12
Outside Range from XenoGene
52
52
39
39
39
Outside Lab Range (+/- 1.96SD)
43
15
17
36
7
Outside Box-Plot-Whiskers
146
51
83
227
43
Outside Kaltoft-Møldrup
251
189
105
212
158
Condition Est. Over 99%ile
1
5
0
0
3
Condition Est. Over 95%ile
2
14
0
5
13
Condition Est. Over 90%ile
11
28
2
11
21
Enzymes Over 99%ile
7
68
5
19
37
Enzymes Over 95%ile
22
281
209
123
250
Enzymes Over 90%ile
58
435
361
317
409
Enzymes Under 10%ile
219
354
59
48
201
Enzymes Under 5%ile
173
265
34
24
144
Enzymes Under 1%ile
138
94
13
12
79
Compounds Over 99%ile
3
44
1
13
16
Compounds Over 95%ile
15
186
82
68
87
Compounds Over 90%ile
27
297
154
153
183
Compounds Under 10%ile
882
889
985
987
875
Compounds Under 5%ile
862
859
959
963
841
Compounds Under 1%ile
845
802
935
952
820
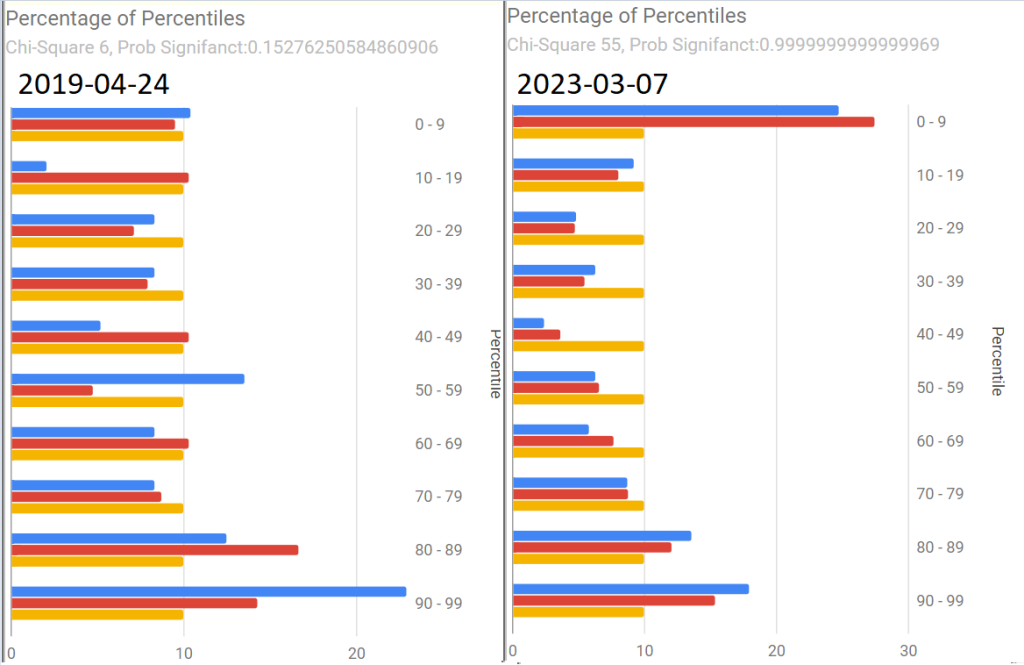
As with Tess, the percentages by percentile which I noticed tend to have over representation with ME/CFS and Long COVID in the 0-9 percentile. We see this pattern at the start, with improvement and then a bounce back to high numbers in the last sample
Tamara suggested that I convert the tables below to charts. Both are now available on the site.
Pretty Pictures
Tamara suggested that I convert the tables below to charts. Both are now available on the site.
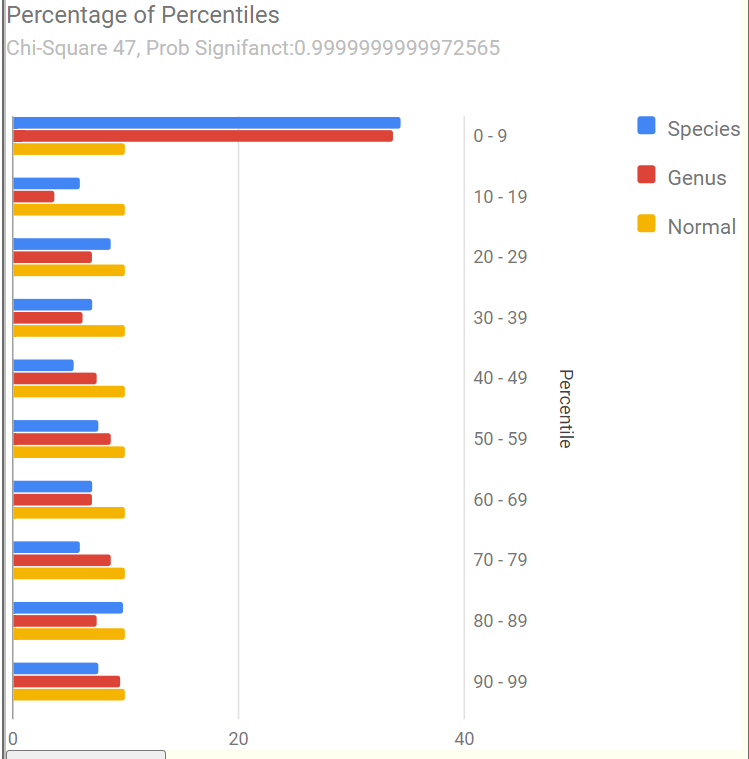
First, an old sample that she happened to have where we see Chi-Square at 6. The first of the recent samples had it jumping to 55, A normal microbiome is expected to have a Chi-square < 13. A higher value indicates a statistically significant, abnormal microbiome.
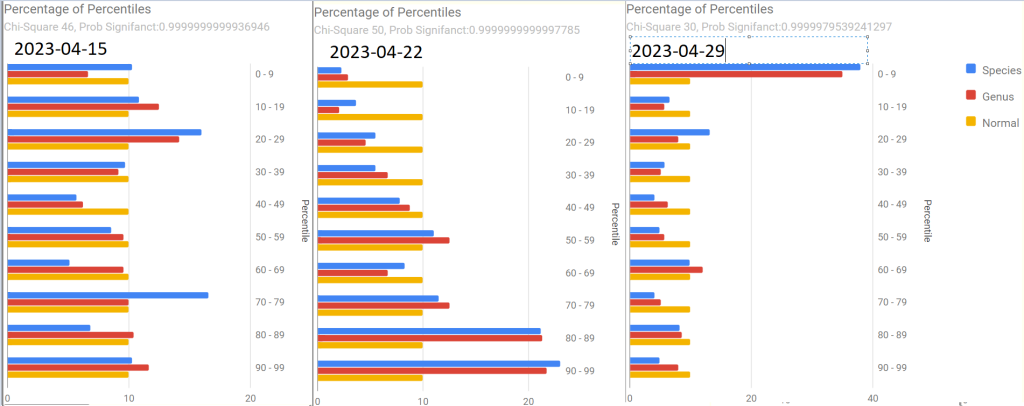
The next three show the changes with antibiotics. Chi-square went from 46 to 50 with a dramatic shift and then drifted down to 30.
The latest sample increased upward again, with the pronounced spikes that are common with ME/CFS being there.
The raw numbers are also shown. I will spare your eyes by omitting them.
The Events Around the above Samples
7 Mar – Before
23 Mar – Day 4 AmoxClav
15 Apr – More
22 Apr – Final Day of AmoxClav (30 days of AC)
This sample has a low Lab Read Quality, this may account for the number of spikes in its report.
29 April – After 3 days of Aprepitant + Erythromycin (this was a BIG difference from Tess and was the intervention that seemed to give me the baseline increase this time).
As with Tess, let us see how these items rank in each sample. As with Tess, imipenem is the most common best suggestion.
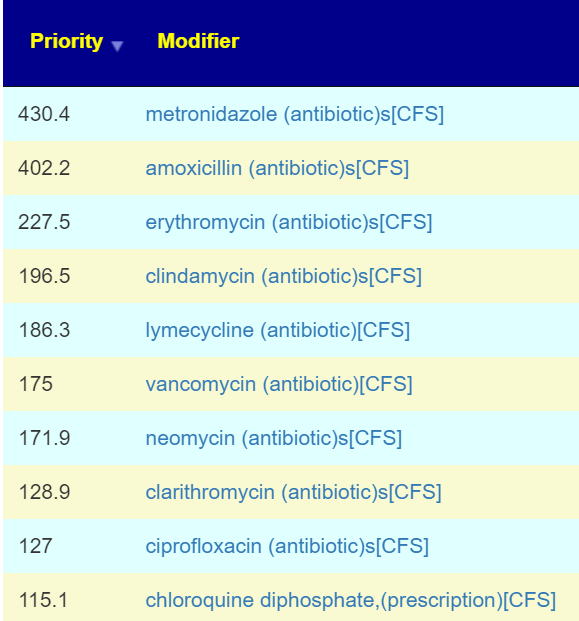
As a result of a conference call with some of the Remission Biome Project, and Dr. Jadin’s Current Protocol for ME/CFS. I annotated all of the antibiotics used in studies for ME/CFS, Lyme, and related conditions with [CFS]. This allows us to quickly see the “consensus” antibiotics (i.e. used in studies and suggested by microbiome prescription algorithms).
The top ones are shown before (Just enter “CFS” in the Search dialog)
Only two of these were negative for her (doxycycline and ampicillin) with docycline sibling, minocycline being just 21).
I would suggest using this list to pick 2 antibiotics to do a one week course and then take a 3 week break. After the course, then do some of these probiotics. I am inclined to omit L.Casei because the strain used in Yakult is a negative. Thus we end up with these three as top suggestions. P.S.
Note the weight of these are above many of the antibiotics above. I usually advocate single species. The Bifido is available from Custom Probiotics with their recommended dosages above the amount listed above.
Part Deux — More Samples!
Her description of subjective changes: generally keep improving in terms of PEM, function etc. (was definitely a dip around the 2nd ‘constipation’ sample)
1st, [2023-06-14] in the series just a temporal sample, no additional treatments
2nd, [2023-07-15] in the series I had a major episode of constipation – wanted to catch that
3rd, [2023-07-20]last one was was post my 2nd treatment of aprepitant+erythromycin
Sample Comparison
We include the prior one above for easy reference). The key change items are:
The new Anti inflammatory Bacteria Score has seen a dramatic increase from 17%ile to 73%ile. The four prior samples were 7.6%ile, 8.2%ile, 3.9%ile and 6.9%ile
Outside Kaltoft-Møldrup is dropping. In terms of %age of reported: 32% -> 28% -> 29% ->16%
The high and low Enzymes also seem to be dropping
The last sample had a Chi-Square of 9, that is a probability of 0.54 instead of the .9999999… for all other samples. Unfortunately, the poor read quality makes this fuzzy.
Note: The last sample has a low read quality (thus less bacteria types are being reported)
Criteria
22-May
14-Jun
15-Jul
22-Jul
Shannon Diversity Index
69.4
29.20
43.00
15.00
Simpson Diversity Index
54.7
7.60
27.50
60.00
Chao1 Index
72.4
0.87
21.40
8.30
Anti inflammatory Bacteria Score
17.0
30.90
43.60
73.20
Chi-Square Score
49
51
32
9
Lab Read Quality
7.2
10.9
6.6
2.3
Bacteria Reported By Lab
659
752
512
375
Bacteria Over 99%ile
10
12
1
4
Bacteria Over 95%ile
22
24
2
20
Bacteria Over 90%ile
45
41
13
39
Bacteria Under 10%ile
199
229
189
19
Bacteria Under 5%ile
186
208
184
3
Bacteria Under 1%ile
167
165
166
0
Lab: BiomeSight
Rarely Seen 1%
25
13
0
0
Rarely Seen 5%
49
37
7
1
Pathogens
32
34
36
21
Outside Range from JasonH
4
7
7
4
Outside Range from Medivere
14
19
19
14
Outside Range from Metagenomics
6
7
7
6
Outside Range from MyBioma
4
6
6
4
Outside Range from Nirvana/CosmosId
18
19
19
18
Outside Range from XenoGene
33
34
34
33
Outside Lab Range (+/- 1.96SD)
11
12
1
13
Outside Box-Plot-Whiskers
56
75
23
50
Outside Kaltoft-Møldrup
209
212
150
61
Condition Est. Over 99%ile
0
0
1
0
Condition Est. Over 95%ile
0
0
1
0
Condition Est. Over 90%ile
1
0
3
0
Enzymes Over 99%ile
62
1
5
2
Enzymes Over 95%ile
130
3
18
11
Enzymes Over 90%ile
215
12
99
33
Enzymes Under 10%ile
429
211
171
304
Enzymes Under 5%ile
310
146
142
211
Enzymes Under 1%ile
152
85
73
47
Compounds Over 99%ile
31
0
3
1
Compounds Over 95%ile
64
2
9
11
Compounds Over 90%ile
106
7
48
24
Compounds Under 10%ile
959
1096
1009
1015
Compounds Under 5%ile
909
1041
981
971
Compounds Under 1%ile
860
1009
956
922
Since we had a symptom of constipation, let us see how well the samples match that reported from Studies on PubMed — there were no matched. When we went to our Special Studies, we see that the microbiome followed the reported symptoms. We then look at the top value from Special Studies — which was Long COVID for all samples. We see the lost of ground around the constipation and then regaining the progress.
Criteria
22-May
14-Jun
15-Jul
22-Jul
Special Studies
7%ile
14%ile
15%ile
7%ile
Top Item Long COVID
35 %
44 %
41 %
36 %
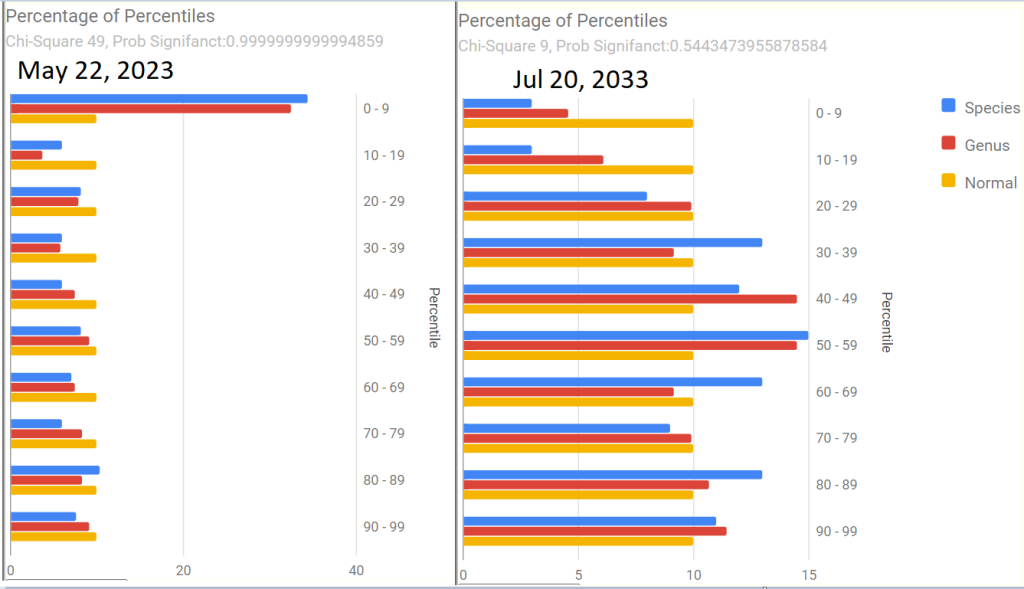
Next we go and look at aprepitant and erythromycin
The Percentage of Percentile show quite a shift — unfortunately, it is unclear if this is a temporary after effect of constipation, poor lab read quality, or the above aprepitant and erythromycin. The next sample may resolve this issue.
Is the Project working — YES
We are seeing both subjective improvement and object improvements.
Personally, I like what appears to be a shift towards Cecile Jadin’s approach — not continuous antibiotics but a course (7-10 days) followed by a break (ideally 3 weeks). Often I find that ME/CFS people tend to be impatient and just want to keep pressing on hard… which I have observed often result in tripping and rolling down the hill to where they were (or worst).
Postscript – and Reminder
I am not a licensed medical professional and there are strict laws where I live about “appearing to practice medicine”. I am safe when it is “academic models” and I keep to the language of science, especially statistics. I am not safe when the explanations have possible overtones of advising a patient instead of presenting data to be evaluated by a medical professional before implementing.
I can compute items to take, those computations do not provide information on rotations etc.
I cannot tell people what they should take or not take. I can inform people items that have better odds of improving their microbiome as a results on numeric calculations. I am a trained experienced statistician with appropriate degrees and professional memberships. All suggestions should be reviewed by your medical professional before starting.
The answers above describe my logic and thinking and is not intended to give advice to this person or any one. Always review with your knowledgeable medical professional.
During the questions period of Jadin’s presentation: Dr. Jadin’s Current Protocol for ME/CFS; Questions were asked about her treatment in terms of it’s target and what microbiome prescription does. I thought a blog post may help people understand how microbiome prescription side-steps a Pandora box of theories.
A simple Premise: Fix the microbiome and symptoms will improve!
In Dr. Jadin’s presentation, she identifies a host of causes that could result in ME/CFS and similar conditions. For example Giardia — IBS/CFS/Long Covid Insight from Bergen’s Giardia Infection, Lyme, or my post from 2016, Post Infection Fatigue, virus: HHV6, EBV and of recent note: COVID. The question arises: Is the source still there? The pragmatic answer is likely yes, at low but significant levels (i.e. maintenance levels).
Not only is it there, but there is likely a half dozen low level infections associated with ME/CFS. WHY? When the microbiome goes off, the immune system follows it. Virus reactivation happens because the immune system is not firing on all cylinders. For example, your body may keep fungus well controlled in your living environment before; now you have fungi problems added to the mix.
Chasing Symptoms Trap
Often people will be focused on one symptom or lab result. For example: How do I reduce my methane levels, How do I reduce my Interleukin 6 levels, how do I get rid of brain fog, etc etc etc.
I do not have the answers for those questions, nor do I care. I review the body as a very complex dynamic organism with a great amount of interactions. My sole target is the microbiome and that is a big target — over 18000 different bacteria are reported from retail microbiome tests, 8,000+ different enzymes, 18,000 different compounds.
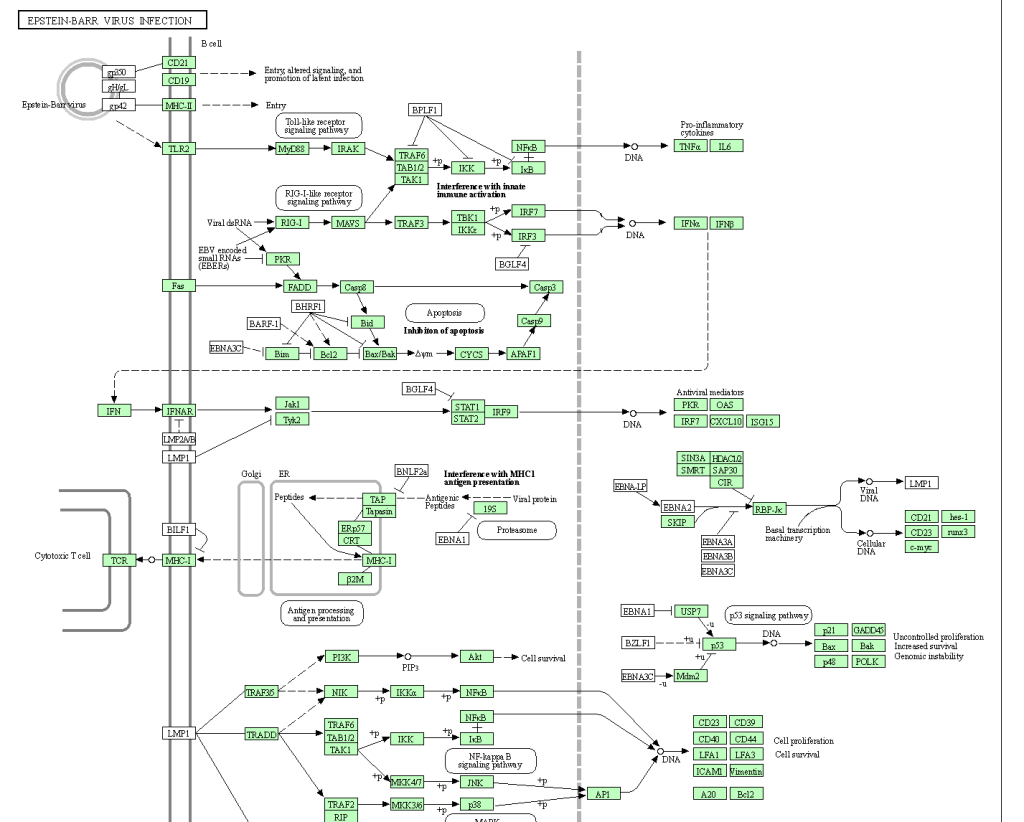
Let us take just one ME/CFS associated item: Epstein-Barr virus. Some of the interactions and interplays are shown in the chart below (See KEGG for full chart). So, you are wanting a single magic supplement?
My goal is very simple, normalize the microbiome and thus normalize the immune system and the levels of the 26,000+ substances involved. Then, and only then, will issues of substance appear (if any).
No matter what the infection (virus, fungi, bacteria) – they need “food”
Where does the food come from? The microbiome. Correcting the microbiome should starve the bad guys and feed the good guys is the simple concept. All of these infections are known to alter the microbiome — and we can reasonably assume that it is done to make the human body more friendly to the infection.
Now with 18,000 bacteria and 26,000 substances, no person can either read nor keep all of the available data in their brain. I happen to have the skill sets to encode much of the data and build a fuzzy logic expert system around the data – that’s my skill set.
Why does my recommendations often matches Jadin’s protocol?
If we assume the infection is still there, we likely have a strong association between the infection and the microbiome bacteria. What encourages the infection, likely also encourages a subset of microbiome bacteria; and the reverse. The microbiome may just be a proxy for the infection with the odd-characteristic that we may be able to determine effective antibiotics without needing to identify all of the infections present. The infection and the microbiome in one sense are mirrors of each other.
This is the philosophical basis that I am working from. As with best modelling practices, if a model predicts and the predictions are correct, you keep to the model (even if it is full of orcs and hobbits) until it breaks — then you work on building a better model.
The microbiome may be a sufficient proxy for the co-infections involved with ME/CFS.
It is easier, faster and cheaper to test – especially because it is available at a low cost, direct to consumers.
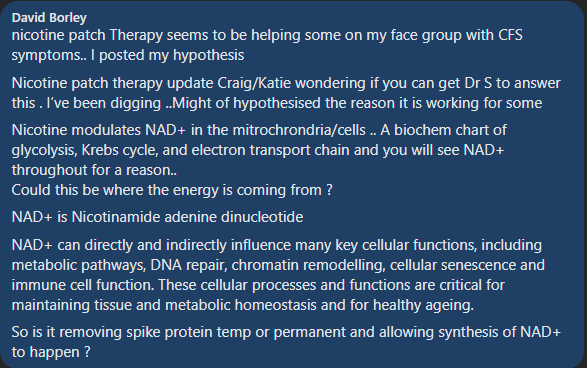
Nicotine often shows up in suggestions. On some people, quite high. It was included because we include everything we find studies for (including Round-Up!). Then I got a reader with ME/CFS who found that nicotine patches caused a major improvement. Then I saw someone mention that 30 years ago, smoking/nicotine was suggested by some MDs to stop UC’s Flares.
nicotine modulates the immune system, inhibits innate and acquired immunity and is used in treating many autoimmune diseases. It often stimulates the α7 receptor and causes an anti-inflammatory state in the body. This study is designed to evaluate the role of nicotine treatment on immune system. The results showed that nicotine affects many cells in immune system, alters the downstream intracellular mechanisms and changes lymphocytes polarization.
Smoking tobacco is associated with a number of gastrointestinal disorders. In some, such as Crohn’s disease and peptic ulcer disease, it increases the risk of disease and has a detrimental effect on their course. In others, such as ulcerative colitis, it decreases the risk of disease and can have a favorable effect on disease course and severity.
Ulcerative colitis (UC) is predominantly a disease of non-smokers and treatment with transdermal nicotine improves symptoms in UC patients, whereas smoking seems to have a deleterious effect in patients with Crohn’s disease (CD).
Anecdotal reports suggest that smoking may be beneficial for patients with inflammatory bowel disease (IBD) as nicotine may act through inflammatory mediators within the colonic mucosa….Moreover, concentrations of IL-1beta and IL-8 were significantly reduced in smokers with UC compared with nonsmokers with UC.
In this relatively small study of patients with active Crohn’s colitis, 6 mg nicotine enemas appeared to be of clinical benefit in most patients. They were well tolerated and safe.
It appears that smoking is bad for Crohn’s, but nicotine may be beneficial. Most studies are on smoking and not nicotine in isolation. IMHO, the suggestion of nicotine is probably a valid (and unusual) one.
Microbiome Prescription computes items that are likely to cause positive shifts in the microbiome. These positive shifts are expected to reduce symptoms and symptom severity. This is only part of a treatment plan. How much to take? When to take it? Interactions between suggestions are clinical issues that are usually based on clinical experience. We do not have that wisdom.
We can provide some guidance from the literature:
List of dosages used in clinical studies for many items are available here ??️ Dosages for Supplements. Our general suggestion is to use the highest dosage by starting at a low dosages and slowly increasing.
We provide information about interactions of various items with probiotics. Our general suggestion is not to take items together that conflicts. For example, taking an antibiotics or herbal oil/extract that reduces a type of probiotic with that probiotic. Wait until the course of antibiotics or herbal oil/extract ends, then take it (to help restore the lost population).
Our thinking has been greatly influenced by the work of Cécile Jadin, MD – who is a surgeon. She applied models from her father’s time at Pasteur Institute of Tropical Medicine when he worked with a Nobel Prize Winner. She has had over 25+ years treating difficult conditions: ME/CFS, Chronic Lyme Disease, Chronic Q-Fever and Rickettsia infections. See Dr. Jadin’s Current Protocol for ME/CFS
Our general interpretation of her model gives us some general rules to follow are:
Pairs of antibiotics for 7 days and then 21 days off and then different ones for the next month
Antibiotic means prescription antibiotics AND Herbal antibiotics.
Typically two dosages a day, 12 hours apart
See Jadin’s notes for her suggestions of things not to do with certain antibiotics
Probiotics should be viewed as antibiotics (many produce natural antibiotics)
There are good and bad probiotics. You do not want to play Russian roulette with a mixture of both good and bad.
Caution: for me, some probiotics at bed time will cause deep sleep (with night sweats on some) while others will make getting to sleep hard. Adjust the time to your response.
A 4 week cycle may look like this:
1st week on a pair of antibiotics,
2nd week on a herbal oil or extract
3rd week on a probiotic — ideally a single species probiotics at desired dosage
4th week rest
At the end of the 4th week, take another microbiome sample. We want to have some natural stabilization of the microbiome before the next course correction.
If no antibiotics are involved, then do a different herb or spice instead. My personal preferences are two from the following list (make sure they are positive for you):
Wormwood
Olive Leaf Extract
Neem
Triphala
Tulsi
Amino acids and vitamins can usually be taken continuously.
Pre- and post- biotics should be started with the probiotic AFTER verifying that it increases the probiotics selected (see tool above). Example for Human milk oligosaccharides is shown below.
Picking items on Suggestions
We are walking thru a vast desert devoid of good studies with a few oasis. We compensate by using fuzzy logic. In keeping with increasing odds, my usual advice is to look at the highest priority item number and divide by two. Those over half (50%) of this should be your main focus. Similarly, look at the most negative item and those more negative than half of that are items to reduce or eliminate. For example:
Highest Priority: 800, look at items between 400 and 800
Lowest Priority: -450, look at reducing items between -225 and -450.
Review with your Medical Professional
At least, inform them of what you are going to do (by email, message or letter) and ask “Do you see any problems?”. 99% of the time the response will be silence, or a “I don’t see an issue”. If something goes wrong, you have a defense against a blame game….
Finding a knowledgably experienced medical professional is a challenge. Often the reality is that you have to educate your medical professional which is a slow process. My usual strategy is to bring in 1-2 summaries or papers printed from the US National Library of Medicine each time after finding a medical professional that is interested in learning more (i.e. no burn out, patient exhaustion, etc.).
Cécile Jadin, MD, has very graciously put together a power point on the state of her protocol and allowed me to share it. This protocol has been in use for over 25 years by her with a high success rate (90%). The protocol actually dates back around 50+ years (for a condition with a different name).
For earlier notes from her, see C.Jadin Resources which links to some of her earlier presentations.
My Experience
The basics of this protocol put me into remission around 2000 and has put me into remission for flares. Far more important, it resulted in my understanding the complexity of this condition’s treatment. Even today, I view many MDs keeping to a naïve one-shot magic-bullet approach: “we need to find the virus (i.e. EBV, HHV6, etc) or bacteria that triggered it; find a drug to treat it and the patient is cured!” I have read so many accounts of people being “cured by X, but it stopped working after N months and X does not work anymore”.
Dr. Jadin has many decades of clinical experience treating ME/CFS and related conditions. She built upon clinical experience treating this type of condition. I have decades of doing software development.
Jadin and I are two sides of a Treatment Coin
Cécile Jadin is a MD with decades of clinical experience treating ME/CFS applying and evolving a protocol that she inherited from her father’s time at the Pasteur Institute of Tropical Medicine. I am a high functioning autism person well trained in Artificial Intelligence and Statistics who has applied it to the microbiome. My AI algorithm very very often suggests the same set of antibiotics and supplements that she uses. The algorithm works off bacteria only (and thus ignores many other co-factors). We walk different paths and end up in the same treatment approach.
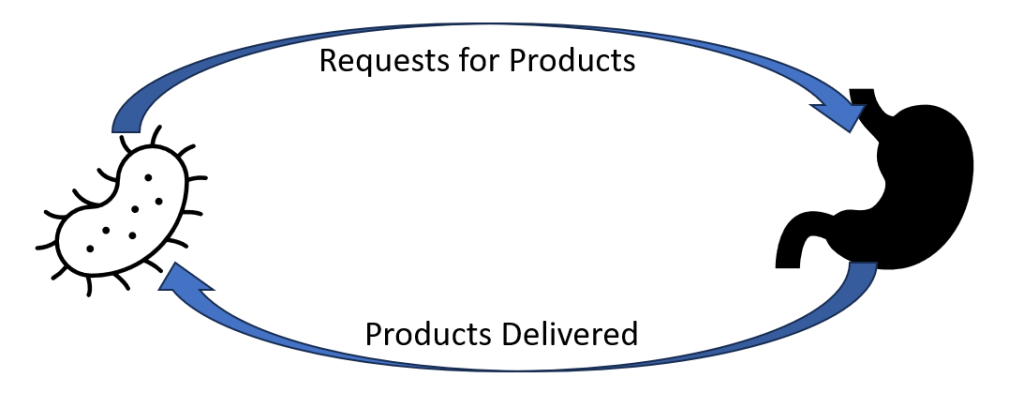
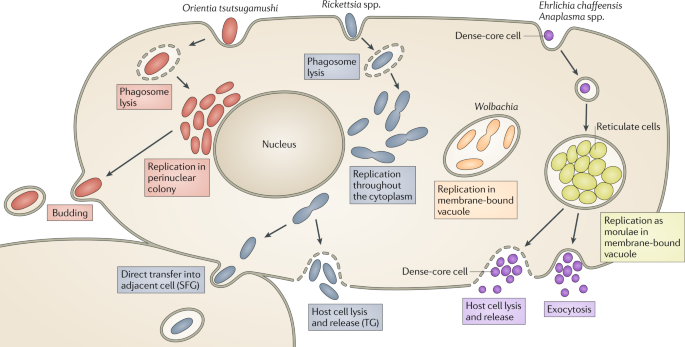
She talks about Obligated Intracellular Organism or OIO. This term may be unfamiliar to many, for some background readings see this Research Topic on Frontiers. I talk about the bacteria in the gut.
They are very interconnected with a lot of information exchanged between them. OIO sends mis-information messages to the gut to produce more of this or that enzyme, metabolites, compounds [Products]. There are over 26,000 different products potentially involved. The gut receives this information and fill these bogus orders. The OIO gets its supplies and proceed to prosper. A side effect of these bogus production orders are symptoms – they could be view as pollution from the production. The symptoms often depends on a person’s DNA.
This cycle needs to be broken. This may be done by attacking the command center (the OIO) or attacking the factories (the microbiome) or both.
Original Motivation
One of the goal of building my AI was to try to identify the factors for non-responders. To me, it appears to be due to variations in the microbiome. Recently there has been many studies reporting that the difference between responders and non-responders for both cancer treatment and the severity of COVID has been the patients microbiome. The AI can suggest what to take; Jadin’s clinical experience provides information on how to take it.
Remission is the Target, not who is right
Patients and their MDs can go down two path, the paths actually run besides each other.
Follow Cécile Jadin process and protocol precisely
Follow Cécile Jadin process but use iterative sets of suggestions from Microbiome Prescription. By that, pick 1-2 of the top CFS tagged antibiotics, then at the end of first month, take a new microbiome sample and start with the secondary CFS tagged antibiotics (while waiting for the results).
The latter approach can be tried without prescription antibiotics because it identifies probiotics (that often produces natural antibiotics) and herbs (with antibiotic characteristics) and thus allows self-treatment for those without a cooperative medical professional. This no-antibiotics approach will likely work slower for most people. I discourage self-treatment, but often there is no alternative. My first choice is keeping strictly to clinical experience using the microbiome suggestions to select between clinical alternatives.
The Cécile Jadin’s process of alternating substances with breaks is a critical factor. In terms of modelling effectiveness (my expertise) — there is no question, it is the rational approach that treats everything as living entities and not mechanical nuts and bolts.
Video Presentation by Cécile Jadin
Short Version (35 minutes)
The bare presentation.
Long Version (65 minutes)
This version includes questions and answers from participants(and chit-chat). Her presentation starts at 5 minutes into it. At the end a patient shares her experience after the first 3 months.
Power Point as a PDF
You may download her presentation below as a PDF file. Or listen to it on YouTube which is intended for people having difficulty reading (common symptom with ME/CFS).
“All those antibiotics MUST be taken: after food ( not only water ) and without any dairy products. Patients must avoid sugar intake and some supplements(for example magnesium, glutamate, vitamin D). Antibiotics should be taken in the morning and the evening”
“Duration of treatment: 1 – 3 years.” Symptom remission may occur sooner, but that is usually just a tactical victory and not a strategic victory. You won one battle, but the war is not over.
Probiotics:
“Taken at noon only. No specific ones, but they must also be rotated (like the antibiotics)”
Many of these conditions can be transferred from human to human with someone who has never been to Africa having an OIO and those can be unknown in your country (without lab test facilities being available) but they are well known in Africa or South America. You may be told: “So, we have run tests for everything and everything came back negative — you have an atypical condition with no known treatment”.
Bottom Line
Medical treatment suffers from one dimensional linear thinking that often uses a “nuts and bolts” mechanical model. The model and understanding of Dr. Jadin assumes a living organization that changes and adapt. The problem bacteria (be it OIO or microbiome) will literally play hide and seek with treatments. I share this perspective.
Some Possible Paths Forward
Depending on the cooperation of your MD, availability of detailed microbiome tests, etc.
Follow Dr. Jadin protocol
Follow the path being discussed in the Remission Biome Project:
Using Microbiome Prescription to generate a list of candidate antibiotics and then take the highest ranked on that which is on Dr. Jadin’s list – following Dr. Jadin’s pattern of alternating and pulsing
Implement the non-prescription suggestions of to avoid or to take. That targets the factory side (that is the gut microbiome), not the OIO side of the cycle show above. It simply improves the odds.
Do not use antibiotics (either by choice or by lack of cooperating MD) and use the advanced suggestions based on your microbiome sample with a new microbiome test every 6-8 weeks. Each new test will alter suggestions (especially probiotics). All suggestions should be reviewed by your medical professional. See this post: We can suggest what to take, but not how to take! for a more explicit description.
Whilst a quick apparent remission may occur, Dr. Jadin’s opinion is that you need to keep to it for at least a year, in some cases up to 3 years. Having a remission that lasts 3 months and then relapses makes the next remission much harder to obtain.
A current project using antibiotics has two analysis done showing significant subjective and objective improvement.
Q: “this doesn’t address the causes of ME/CFS. Also no mention of any nutrient deficiencies typically seen in every case of ME/CFS I’ve seen, or genetic factors, or anaemia, or thyroid dysfunctions, or other causes and factors.”
Read this again, OIO is a valid cause for many ME/CFS cases and this has been reported in many studies. and there are many more. A microbiome shift is well documented in studies for ME/CFS and that by itself may be the cause of ongoing ME/CFS. Explicitly treating nutrient deficiencies is treating symptoms and not causes. Correcting the microbiome will likely resolve most, if not all, nutrient deficiencies. Microbiome dysfunction is well documented with anemia and thyroid dysfunction. A side effect taking the relevant antibiotic is microbiome correction. See Tess Falor’s experience above where remission came with concurrent normalization of the microbiome (corrected by the antibiotics — either directly or indirectly)
Q: Are you not aware of the black box warning of floxing [fluoroquinolone] with some of those antibiotics? Is this protocol target only for those who have lyme associated with the ME/ CFS. Cause most people in my medical community( not all have lyme)who took them have had horrible consequences from being floxed.
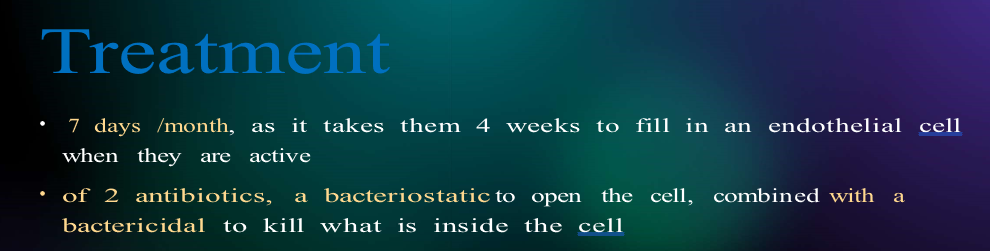
Jadin was asked this question (see long video). She has never encountered this issue. It is critical to note HOW she uses it. Never more than 7 days followed by 3 weeks without antibiotics. For safety, she advises not to exercise while using it. Note that the warning also cites INJECTIONS as well as being seen after weeks on fluoroquinolone
More Questions
Where do prebiotics fit into this 4 week cycle?
This was not asked, and my impression is “however you want” provided they do not impact the antibiotics used.
After one 4 week cycle, I take another microbiome test. Then I start another 4 week course (with the next antibiotic from Dr. Jadin’s list in my case? You wrote you would only take metronidazole in my case.) It will take a month until I have the results. Will the results still reflect my current microbiome after the second 4 week course? Or maybe it is still “good enough”!?
“Good enough” and “Sufficient” are the reality of the world we live it. Ideally, you can test and get results back on the same day. That is not the current reality. It is a maze of what-if choices. My evaluation is that round 2 of antibiotics will likely get more progress [it is unlikely that all of the desired shifts will have been done by the first round]. Testing right after the antibiotics will be a bias sample causing some issues to be underreported. It’s a matter of balancing risks and benefits.
My earlier comments were working off her publications from 2000 and before her presentation.
After I have the results, it will take a few days until I get the antibiotic, the probiotic might not get to me on time (especially CustomProbiotics takes like 2 months, so I would have to look for sth. else!), etc. If one item does not get to me on time, should I take the current one a little longer or make a pause for a few days?
Yes IMHO, look for any local products that have only items in the top 50% of the suggestions is a viable alternative. The exception is if you know that you react to the fillers, etc.
You gave me four probiotics recommendations in your suggestions. With the Jadin approach, I would only do two of them in total right (one in the first and one in the second 4 week cycle)? After that I would already have the new results.
There is no clear guidance for probiotics. My own preference is doing one at a time, but there is no clear concern about doing more than one. In keeping with the pattern for antibiotics, I deem the same pattern for probiotics (because they produce natural antibiotics) is reasonable (just one week per month).
“Patients must avoid sugar intake and some supplements, e.g. magnesium”. Are those general recommendations or only when following the “strictly Dr. Jadin protocol”?
Those are Dr. Jadin’s recommendations from clinical observations. Microbiome prescription reports on specific types of sugars and sweeteners — some to be avoided and some to take. Jadin mentioned explicitly that sugar-craving are a warning sign [i.e. the bad bacteria is sending signals to get more sugar in your system].
Does sugar intake only mean added sugar or also fruit, sweet potatoes etc.?
See above, craving for sweets, i.e. added sugar foods and drinks seems to be her critical concerns.
Herbs also after food?
That I have no information on. My common sense suggestion is if taking them away from food have a negative impact, take them with food.
What is your general dosage recommendation for herbs/herb extracts/herb oils?
I avoid giving explicit recommendation (that is a question for someone with clinical experience). What I have done is found dosages used in clinical studies (and if they were effective). These are dosages that someone with clinical experience found safe. I would advocate starting low and working up. The list is here, ??️ Dosages for Supplements
Can this approach also heal my IBS and food intolerances? Or are there additional things to do for that?
The model that I am using says it is very likely to help significantly with both. I avoid the “heal” and “cure” words. Again this is a model, and not clinical experience.
Regarding that I quickly develop food intolerances, you wrote that taking the herbs every 3 days would be ok. But with the Dr. Jadin protocol I would take the herbs for only one week, so only twice in total!? (These conflicting things make it hard for me to understand what to do, so I am asking this.)
Very food question! See We can suggest what to take, but not how to take! My standing advice is to do just what you are comfortable with, what you can tolerate without concerns. I am not clinical (people dealing). Try your suggestion of twice in a week. Sorry that I cannot provide more advice — but I am trying hard to keep to my expertise only.
Last time I did all the antibiotics in a row, then all herbs, then all prebiotics, then probiotics, each item for 2 weeks. This wouldn’t be a current recommendation of yours anymore right? (Or maybe it was not right in the first place..)
My recommendation is simple, for clinical guidance I feel Jadin’s approach is the best when it comes to antibiotics. That has been her main focus. I take her advice/pattern with antibiotics to other things with antibiotics characteristics: probiotics and some herbs. For other things, we are likely wandering the dark (i.e. in the desert lacking studies for guidance).
I try to avoid giving explicit recommendations (not qualified, lack of clinical experience). When there is significant brain fog with a person, I may cross a line that I prefer not to cross, but cross out of compassion. My recommendation is to base your approach on Jadin’s experience and adapt from there. There are a hundred questions that could be asked… 90% of them will likely be answered with “We just do not know for sure” because there are no studies published.
In the “Dr. Jadins current protocol…” article, the recommendation is that probiotics should be taken at noon only. In the “We can suggest what to take, but not how to take it” article, you talk about probiotics at bedtime. What to do?
Jadin’s advice was for probiotics taken when taking antibiotics, that is midway between antibiotics. If antibiotics are not being taken, then shift the probiotics to when your response to them is best.
For the three Possible Paths forward described in the end of the article, is it possible to say which one is the “best/worst” if all antibiotics would be available?
No. Wanting the best is a common concern; we do not have hard data to answer that. The priority on microbiome prescription is based on the number of studies and the number of bacteria influence in the desired manner.
Or maybe a little less. So the thing is, I am not sure whether I will always get all the antibiotics I want from my source. The approach without the antibiotics (which is probably the one of most MicrobiomePrescription users) should still follow the 4 week cycle from the other article, but does a microbiome test less often, only every 6-8 weeks!? What if I sometimes I get the antibiotic and sometimes have to do without?
Key words are “What you are comfortable with and your medical professional is comfortable with”. The goal is to shift the microbiome, every item is a push.
A reader sent me this note which caused me to do some reflection and an experiment.
Maybe you can help me here. I have two samples from February 2023 (where my function was 90% for the first time in years – I did not use antibiotics to achieve this event it just seemed to gradually happen over several weeks since starting valtrex (MicrobiomePrescription : valacyclovir hydrochloride is an antiviral)).
But then I crashed in March after taking, neem, tulsi and Lauricidin which wiped out my microbiome (at least the one I had before!). Then on May 23rd sample my microbiome looked almost the same as February but I was only experiencing about 75% function. There were some outliers like firmicutes to bac ratio being different and prausnitzii being lower than before – but other than that it looked ok.
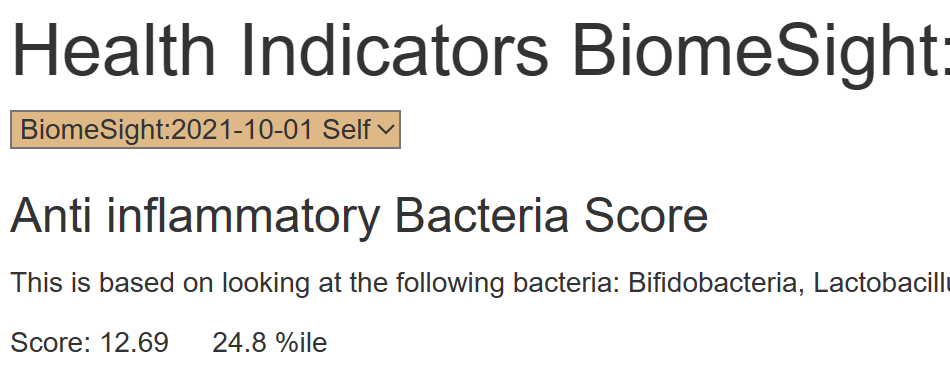
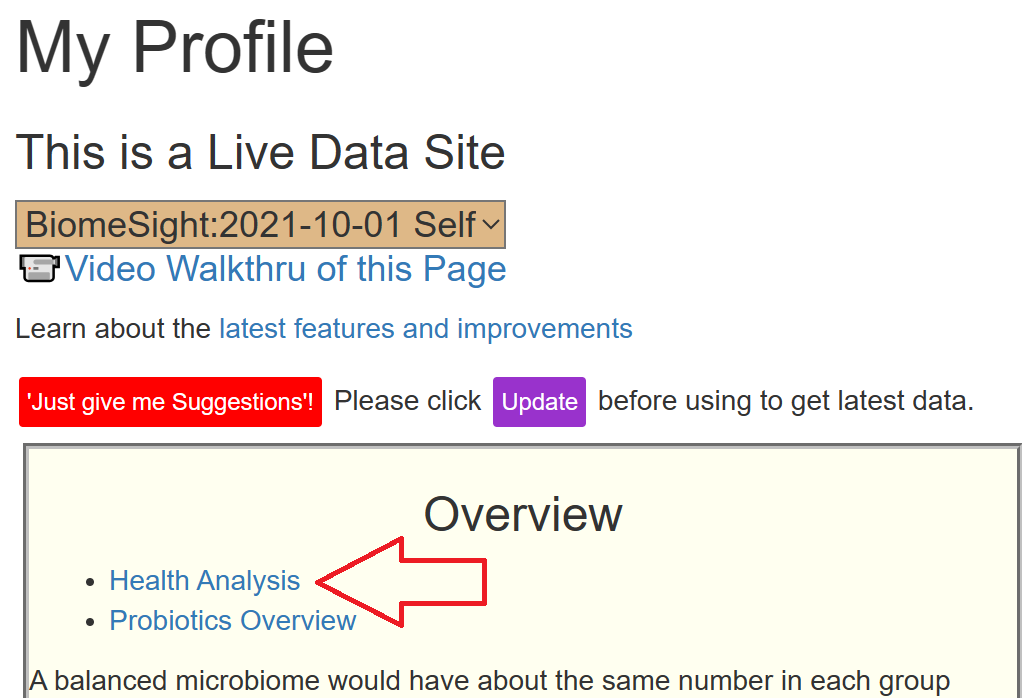
Second, what I did was compute a number based on the bacteria alleged to be Anti inflammatory and added it to Health Indicators page based on his observations and some research.
Where is it on the site?
These are computed on a per-processing-lab basis so the percentile will be appropriate.
This has limited value on a single sample (apart from screaming problems).
For this person we see (Biomesight):
2022-8-17: Score: 11.9 2.5 %ile
2023-2-24: Score: 13.51 93.2 %ile
2023-5-23: Score: 13.15 68.4 %ile
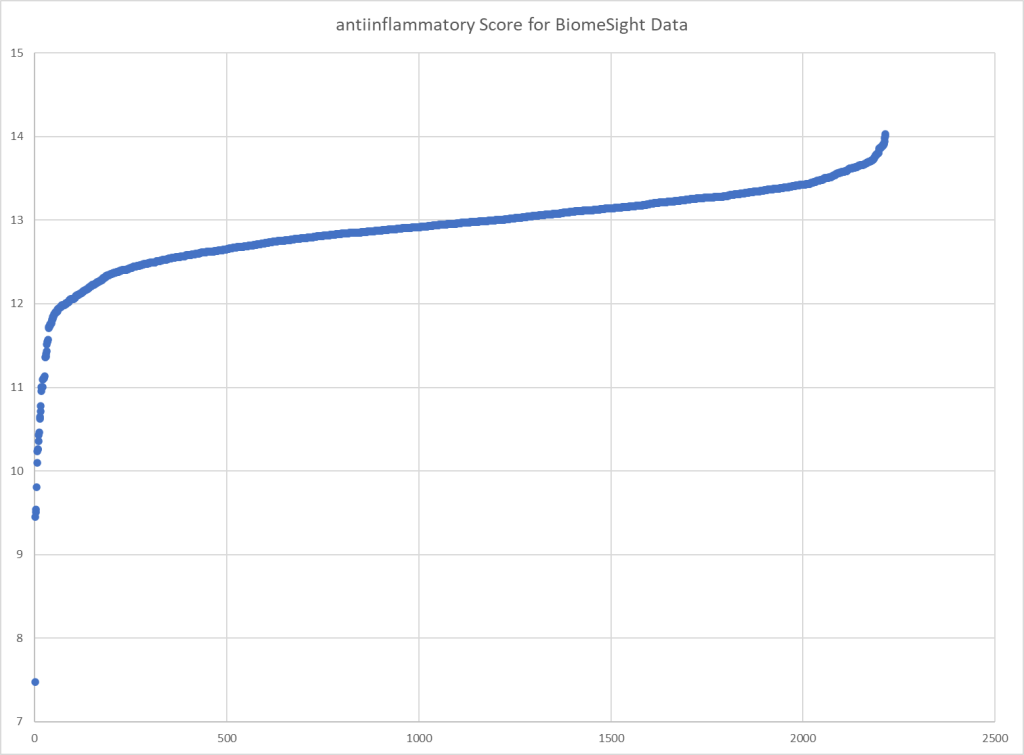
And this follows his subjective experience. Plotting the scores over all of the Biomesight samples, we get our typical score pattern.
User feedback after reviewing “I’ll look into these percentiles I’ve never thought they were useful before! Think I stand corrected.” There is no magic measure that does everything, there are many measures. Some useful for one person and just noise for someone else.
This is different than the body’s Circadian Rhythms. My experience is that it depends on the probiotic — some probiotics taken at bed time will drop me into deep sleep within 10 minutes; other probiotics taken at the same time will keep me wide wake until 3am in the morning — bummer. Why, the probiotic produces enzymes which interacts with the body and the mind. The enzymes vary between probiotics.
This posts reviews some of the literature and attempts to improve mine, and hopefully yours, understanding of the Circadian Rhythm of bacteria with it’s impact on when certain supplements and probiotics should be taken during the day.
There exists a bidirectional circadian interaction between the host and its gut microbiota, and potential circadian orchestration of both host and gut microbiota in response to invading pathogens. In this review, we summarize what is known about these intestinal microbial oscillations and the relationships between host circadian clocks and various infectious agents (bacteria, fungi, parasites, and viruses), and discuss how host circadian clocks prime the immune system to fight pathogen infections as well as the direct effects of circadian clocks on viral activity
This may account for items like night-sweats, for example, my sleeping body temperature is much higher than my usual daytime temperature.
The Literature
“Conditions of dysbiosis have been linked to circadian rhythm disruption, metabolic alterations, and release of neurotoxic products, all contributing to neurodegeneration.” [2023]
“the gut microbiota can influence the host circadian rhythm by a variety of mechanisms including through interacting with the host immune system. The intricate and complex relationship between the microbiota and their host makes it challenging to disentangle host behaviors from bacterial circadian rhythms and clock mechanisms that might govern the daily oscillations observed in these microbial populations.” [2023]
“Misalignment of the clock can cause obesity, which is accompanied by reduced levels of the clock-controlled, rhythmic metabolite NAD+. Increasing NAD+ is becoming a therapy for metabolic dysfunction; however, the impact of daily NAD+ fluctuations remains unknown.” [2023]
Unconjugated bile acids regulate the amplitude and periodicity of circadian gene expression in the ileum, colon, and liver
High-fat diet
Impaired central and hepatic circadian clock gene expression Dampened circadian oscillations of gut microbiota Altered microbial diversity
Time-restricted feeding
Increased gut microbial diversity Reduced total cholesterol and triglyceride levels
Altered light-dark cycle and mutation of the Clock gene [Bmal1]
Microbiota dysbiosis: increase in proinflammatory bacteria and decrease in anti-inflammatory bacteria Causes dysbiosis
Germ-free mice receiving stool from jet-lagged humans
Enhanced weight gain -Higher blood glucose levels after oral glucose challenge
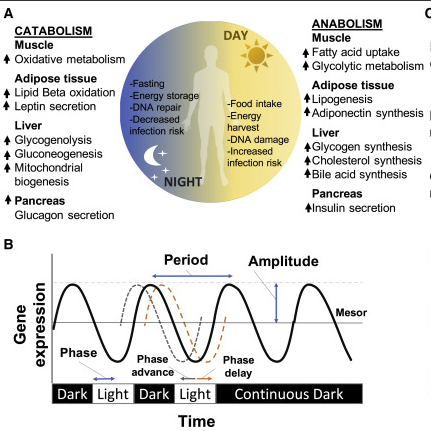
Some Basic Visuals
The following illustrate the difference between day time and night time. “The endogenous clock anticipates the daily fluctuation in the risk of infection inducing a stronger immune response at the beginning of the active phase of the light/dark cycle“. One common immune response is histamine / mast cells. This is seen in this study The Circadian Clock Drives Mast Cell Functions in Allergic Reactions [2018] which states: Allergic conditions such as asthma or allergic rhinitis have historically shown circadian bias as the severity of symptoms is exacerbated between midnight and morning time and exhibits prominent 24-h variation.
Needless to day (I hope needless), microbiome samples should be taken at the same time of day and preferable on the same day of the week (since shifts between a work day and a day of rest could be significant).
The earliest use of antibiotics for treating ME/CFS that I am aware of, dates from the late 1990’s with articles in Journal of Chronic Fatigue Syndrome (and conference reports prior)
My remission from ME/CFS was done by combining C.L. Jadin protocol with Dave Berg anticoagulant protocol.
Overview of results
First, let us show the numbers and then talk about them. It is clear that there are significant changes. There are a lot of dimensions to consider.
Criteria
2-Mar
9-Mar
21-Mar
3-Apr
16-Jun
Shannon Diversity Index (Percentile)
85.2
79.0
99.8
72.4
16.0
Simpson Diversity Index (Percentile)
72.6
63.4
64.4
77.0
91.4
Chao1 Index (Percentile)
65.7
31.2
77.2
62.9
7.9
Lab Read Quality
8.9
8.7
6
4.5
4.4
Bacteria Reported By Lab
654
533
725
585
389
Bacteria Over 99%ile
2
4
30
11
24
Bacteria Over 95%ile
13
10
70
33
38
Bacteria Over 90%ile
25
23
103
63
55
Bacteria Under 10%ile
287
213
123
113
140
Bacteria Under 5%ile
253
173
66
48
96
Bacteria Under 1%ile
219
135
17
8
46
Lab: BiomeSight
Rarely Seen 1%
13
1
38
5
6
Rarely Seen 5%
28
9
107
17
29
Pathogens
36
31
50
40
36
Outside Range from JasonH
6
6
9
9
8
Outside Range from Medivere
15
15
22
22
22
Outside Range from Metagenomics
7
7
9
9
9
Outside Range from MyBioma
5
5
6
6
6
Outside Range from Nirvana/CosmosId
26
26
18
18
15
Outside Range from XenoGene
28
28
46
46
42
Outside Lab Range (+/- 1.96SD)
6
8
56
17
27
Outside Box-Plot-Whiskers
44
36
124
70
67
Outside Kaltoft-Møldrup
233
169
207
137
170
Condition Est. Over 99%ile
0
0
13
10
48
Condition Est. Over 95%ile
1
0
24
35
75
Condition Est. Over 90%ile
2
2
34
55
84
Enzymes Over 99%ile
0
0
347
606
957
Enzymes Over 95%ile
7
0
635
970
1145
Enzymes Over 90%ile
24
28
746
1159
1228
Enzymes Under 10%ile
506
515
561
237
245
Enzymes Under 5%ile
378
360
422
143
174
Enzymes Under 1%ile
194
166
120
52
94
Compounds Over 99%ile
0
0
225
215
617
Compounds Over 95%ile
2
0
355
410
732
Compounds Over 90%ile
8
11
441
520
778
Compounds Under 10%ile
1243
986
1105
902
822
Compounds Under 5%ile
1156
926
1032
856
796
Compounds Under 1%ile
1115
875
936
828
767
Next are the percentages by percentile which I noticed tend to have over representation with ME/CFS and Long COVID in the 0-9 percentile. We see this pattern at the start, with improvement and then a bounce back to high numbers.
2-Mar
2-Mar
9-Mar
9-Mar
21-Mar
21-Mar
3-Apr
3-Apr
16-Jun
16-Jun
Percentile
Genus
%
Genus
%
Genus
%
Genus
%
Genus
%
0 – 9
65
40%
51
36%
28
15%
29
19%
35
36%
10-19
13
8%
16
11%
36
19%
23
15%
9
9%
20 – 29
11
7%
16
11%
20
11%
23
15%
14
14%
30 – 39
5
3%
9
6%
17
9%
17
11%
4
4%
40 – 49
13
8%
10
7%
14
8%
11
7%
5
5%
50 – 59
12
7%
8
6%
10
5%
8
5%
3
3%
60 – 69
12
7%
9
6%
6
3%
14
9%
1
1%
70 – 79
12
7%
3
2%
10
5%
6
4%
5
5%
80 – 89
10
6%
10
7%
15
8%
9
6%
7
7%
90 – 99
11
7%
8
6%
30
16%
15
10%
15
15%
Total
164
140
186
155
98
2-Mar
2-Mar
9-Mar
9-Mar
21-Mar
21-Mar
3-Apr
3-Apr
16-Jun
16-Jun
Percentile
%
Species
%
Species
%
Species
%
Species
%
Species
0 – 9
41%
94
43%
79
13%
40
17%
36
21%
31
10-19
6%
14
9%
16
15%
44
13%
28
9%
13
20 – 29
8%
18
9%
16
13%
39
12%
27
15%
22
30 – 39
3%
7
5%
10
10%
29
10%
22
8%
11
40 – 49
7%
17
4%
7
7%
20
8%
17
6%
9
50 – 59
9%
21
5%
9
7%
22
6%
12
5%
7
60 – 69
6%
14
8%
14
3%
10
6%
14
6%
9
70 – 79
8%
18
4%
7
6%
19
7%
15
6%
9
80 – 89
6%
13
8%
15
8%
23
8%
17
10%
14
90 – 99
5%
12
6%
11
19%
57
13%
29
14%
21
Total
228
184
303
217
146
The Events Around the above Samples
2023-03-02 (baseline)
2023-03-09 (during a stomach bug)
2023-03-21 (during a “Level 1” remission while taking Amoxiclav. Level 1 = all symptoms gone. Felt great. Had started Amoxiclav on the morning of 3/20, this sample was taken after 3 doses around 3pm)
2023-04-03 (4 days after stopping Amoxiclav, was on Doxycycline)
2023-06-16 (During 2nd round of Amoxiclav when I felt really bad)
The microbiome results definitely reflected the Level 1 remission on 3-21. The low percentile genus and species percentage almost made it to the target level of 10% from the prior 40%! The Shannon Diversity Index was awesome (the higher the better!).
I have often described correcting the microbiome as being similar to sailing a sailboat along a coast line. Depending on wind and tide, there may be a lot of course changes required. I am curious on the ranking of Amoxiclav[amoxicillin] and Doxycycline with these samples. The numbers below suggests that going on to Doxycycline may have been a poor choice. On the 2nd round of Amoxiclav, it was at just 35% of the highest value recommendation versus 70% on the 1st round.
Note that rifaximin and rifampicin are in the same family and used by some ME/CFS specialists. Imipenem shows up often with ME/CFS samples — but since it is intravenous, not the easiest to get on an ongoing basis.
Take Away and Reflections
This project main purpose was to show that remission can be triggered by antibiotics to another generation of people suffering from ME/CFS. The remission on 21-Mar demonstrates this to be correct both subjectively and objectively (Microbiome data — specifically Shannon Diversity Index and Percentages in different percentiles for Species and Genus). I should emphasis that both of these measures are multi-bacteria measures and do not support the common myth that ME/CFS is caused by a single bacteria.
The critical issue is maintaining remission. How do keep the microbiome where it should be. I often use analogies of cities because we are talking about a city of bacteria. To stop riots and looting in the streets you send in the National Guard (antibiotic). The city is back to normal. The causes of the the riots are still there. Typically lack of opportunities, neglect, etc. in these same ghettos. You must address these other issues. A repeat of sending in the National Guard may have the same effect as the first time OR very different effects – the same can be said for using the same antibiotics.
With bacteria we have two “radical organizations in the ghetto” — The Antibiotic resistant and the Resistors. For example, the bacteria that survive learnt how to avoid the National Guard and proceed to share that skill to other bacteria. Instead of a wall of shields pushing the rioters back, Molotov cocktails rain down on the troops from above.
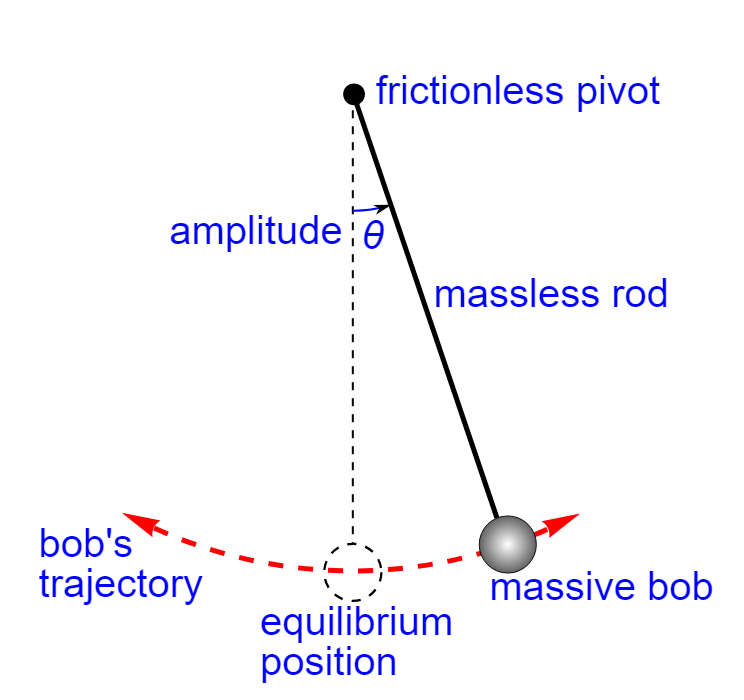
Another analogy is that the gut is a pendulum. The antibiotics, probiotics and other items pushes the gut towards the equilibrium position! There is great joy! The gut is centered… At this point, many people go down the wrong reasoning path — “Keep doing more of the same to stay in remission!“. Remission is lost and the momentum pushes the guts out to the other side!!! You pushed out one devil and seven more devils return! (Math 12:43-45)
The key is to dampen down the swing so there is less and less swing. My personal opinion is that Cecile Jadin’s protocol using antibiotics for only 7 days each month is a very effective way of dampening the pendulum gained from decades of experience.
My approach with Microbiome Prescription is to try to address the whole city. Before taking action, we get intelligence on the nature of the city and decide on the appropriate action for a period of time (typically 4-10 weeks). We then update our intelligence (i.e. microbiome test) and pick the next course of action. Actions may include “food kitchens”, “safe injection sites”, “training programs”, “home repairs”, “on the beat policing”, etc.
There are many people who will state that antibiotics gave me ME/CFS. I do not disagree. Antibiotics can also trigger remission — the problem is WHICH antibiotics. Since every person’s microbiome is unique, there can be no universal “best antibiotic” for ME/CFS. Antibiotics must be selected based on the individuals microbiome (which is the path that Microbiome Prescription took) for the best odds of making the right choice.
My Suggestions Going Forward
I am working with C.L. Jadin, M.D., on documenting her current protocol from almost 30 years of experience using antibiotics for ME/CFS. It will be out soon. I am hoping to have that available within a month. One key aspect of her protocol has been pulsing antibiotics using two at a time. There are a few studies showing that pulsing is more effective. Pulsing often means 7 days on and 21 days off.
Looking at Tess’s last sample, I would propose the following to be considered (items that I picked from the consensus suggestions):
Take a 3 week break from antibiotics (Ideally at the end take another sample)
A common pattern of people is “Just give me a pill to fix me, I want to keep my current life style and I am not prepared to make significant life style and diet changes”. My impression is that making those changes is often required. Inertia is a real maintainer of ME/CFS, especially the pendulum inertia when trying to heal.
Postscript – and Reminder
I am not a licensed medical professional and there are strict laws where I live about “appearing to practice medicine”. I am safe when it is “academic models” and I keep to the language of science, especially statistics. I am not safe when the explanations have possible overtones of advising a patient instead of presenting data to be evaluated by a medical professional before implementing.
I can compute items to take, those computations do not provide information on rotations etc.
I cannot tell people what they should take or not take. I can inform people items that have better odds of improving their microbiome as a results on numeric calculations. I am a trained experienced statistician with appropriate degrees and professional memberships. All suggestions should be reviewed by your medical professional before starting.
The answers above describe my logic and thinking and is not intended to give advice to this person or any one. Always review with your knowledgeable medical professional.


Recent Comments