Today, I got this message on Facebook from some one who got relief for Anhedonia from advice on Microbiome Prescription.
Anhedonia is the diminished ability or loss of interest in experiencing pleasure from activities once enjoyed, feeling emotionally flat, numb, or empty, and it’s a core symptom of depression, schizophrenia, substance use disorders, PTSD, and Parkinson’s
Hi Ken, I’ve taken Enterococcus Faecium Probiotic Powder (Dopamine Support) from Bulkprobiotics for 2 weeks and it has made me laugh at things (which I’ve been unable to do since having anhedonia) but when I stopped the laughter also stopped. How can I make this probiotic stay more permanently in my system? What do I feed it?
To answer that question, we need to look at literally four paths of suggestions. This pattern applies to mono-bacteria requests. The paths are:
Use the association “R2” site based on data from PrecisionBiome.eu to see if any probiotics are known to increase /feed/ it.
Use the associations based on data from Biomesight.com to see if any probiotics are known to increase /feed/ it. This sits on my local server only at present. It’s a fat database.
Doing a search, we link to this page. And then need to sort by “Probiotic” and then “R2” to see which probiotics have the greatest impact. We double click the “R2” to have the highest values first.
Not all of these probiotics are currently available retail in every country. The most likely to be available are listed on this page. Search by name for providers:
Lactococcus cremoris: Not available in isolation. Swedish Filmjölk (SE) / Filmjölk would be my first choice.
Search for bacteria here, takes us to this page. Here we are not dealing solely with probiotics but everything. Clicking on effect to see what has the most evidence/studies, we see most studies report on items that decrease, i.e. your avoids.
Putting “increases” in the search box, we then see this list of items (I leave the rest to you)
Lastly, we click on probiotics to see that list. NOTE: PubMed does not evaluate relative impact (R2 does). We are measuring only the confidence (via number of studies) that it will do some impact.
This a little more obtuse, we are looking for supplements that may be consumed by this bacteria. To get there, you need to login and then change display level to Advance.
Modify your diet to remove the foods with significant evidence of inhibiting Enterococcus Faecium
Bonus
I took your last sample through the condition Odds Ratio algorithm that I am working on with the following results. I was surprised/delighted that every positive prediction agreed with your reported symptoms. In time, this will evolve into better suggestions because of better identification of the key bacteria involved.
SymptomName
Strength
HasSymptom
Immune Manifestations: Bloating
26.7
1
Sleep: Unrefreshed sleep
25.1
1
Comorbid: High Anxiety
23
1
Neurocognitive: Problems remembering things
21.8
1
Neurocognitive: Difficulty paying attention for a long period of time
This document presents the results of statistical analysis on symptoms from viable, self-annotated Biomesight microbiome samples. The methodology for data acquisition is outlined in New Standards for Microbiome Analysis?.
Quick Best Probiotics
For details, see bottom
Bifidobacterium breve
Bifidobacterium longum
Bifidobacterium adolescentis
Lacticaseibacillus (one of the lactobacillus probiotics) is very excessive and Lactobacillus probiotics should generally be avoided. Check your yogurt labels!
Tables have been refined to display only genus- and species-level taxa, the 20 most prominent entries per group, and associations achieving statistical significance (P < 0.01).
The following sections provide the processed data, accompanied by guidance on interpretation and application. Counts of significant bacterial taxa are included, reflecting the application of non-standard but rigorously validated statistical approaches to extensive sample and reference populations, where statistical power derives from dataset scale.
Significance
Genus
p < 0.01
134
p < 0.001
125
p < 0.0001
119
p < 0.00001
105
Averages and Medians
I prefer medians over averages. Medians are the values where half of the people have less and half has more. If the data was a bell-curve, then the values will almost be the same… with bacteria that happens rarely. Look at the bacterua below, we see that for some the average is above and the median below. Should one increase or decrease this bacteria?
If symptom median is higher than reference median, it means there is more of this bacteria. If lower, then less. This ignores how often the bacteria is seen (we average only over reports). IMHO using average value instead of median will often result in a worse situation for the patient
tax_name
Rank
Symptom Average
Reference Average
Symptom Median
Reference Median
Phocaeicola vulgatus
species
7.372
5.774
3.427
5.031
Faecalibacterium
genus
12.482
12.784
12.073
10.514
Phocaeicola
genus
10.908
10.854
9.369
10.392
Blautia
genus
8.97
8.448
7.176
6.431
Lachnospira
genus
1.863
2.746
1.899
1.168
Roseburia
genus
3.574
2.822
1.778
2.222
Phocaeicola dorei
species
1.717
2.935
0.43
0.038
Parabacteroides
genus
3.252
2.611
1.724
2.116
Bacteroides uniformis
species
2.938
2.727
1.571
1.917
Oscillospira
genus
2.656
2.349
1.952
2.285
Parabacteroides distasonis
species
1.943
1.228
0.604
0.911
Clostridium
genus
1.959
1.857
1.364
1.665
Sutterella
genus
1.834
1.64
1.244
1.49
Sutterella wadsworthensis
species
0.734
0.657
0.05
0.262
Coprococcus
genus
1.112
1.438
0.73
0.53
Lachnospira pectinoschiza
species
0.369
0.67
0.34
0.162
Novispirillum
genus
1.036
0.864
0.095
0.259
Insolitispirillum
genus
1.035
0.865
0.095
0.259
Insolitispirillum peregrinum
species
1.035
0.865
0.095
0.259
Bacteroides thetaiotaomicron
species
1.09
1.072
0.466
0.628
Bacteria Incidence – How often is it reported
The common sense belief is that if a bacteria is reported more often, then the amount should be higher. This is often not true. The microbiome is a complex thing. Excessive Lacticaseibacillus (one of the lactobacillus probiotics) is very excessive.
tax_name
Rank
Incidence Odds Ratio
Chi2
Symptoms %
Reference %
Collinsella tanakaei
species
2.43
19.9
37.4
15.4
Anaerofustis stercorihominis
species
2.06
12.7
36.3
17.6
Anaerofustis
genus
1.98
11.4
36.3
18.3
Lacticaseibacillus
genus
1.83
9.2
38.5
21
More or Less often based on Symptom Median All Incidence
This is a little more complex to understand. If we compute the mid point for people with the symptom, then if the bacteria was not involved then half of the reference should be above this value and half below this value. If not, it means that the symptom tends to over or under growth.
tax_name
Rank
Symptom Median
Odds Ratio
Chi2
Below
Above
Moraxella caviae
species
0.002
0.21
22.6
81
17
Moraxella
genus
0.002
0.25
19.1
83
21
Rickettsiella
genus
0.002
0.26
17.4
76
20
Treponema porcinum
species
0.002
0.32
14.3
84
27
Clostridium hveragerdense
species
0.002
0.43
9.4
102
44
Streptococcus infantis
species
0.003
0.55
7.8
808
442
Desulfotomaculum defluvii
species
0.003
0.56
7.4
1033
576
Alkalibacterium
genus
0.003
0.57
6.8
914
521
Hydrogenophilus
genus
0.003
0.58
6.7
1166
671
More or Less often based on Reference Median All Incidence
This is like the above, but with a different line in the sand. Instead of the median of those with the condition, we use the median of the reference set.
tax_name
Rank
Reference Median
Odds Ratio
Chi2
Below
Above
Phocaeicola dorei
species
0.038
2.32
335.2
1171
2721
Corynebacterium
genus
0.012
0.32
324.4
1279
413
Odoribacter denticanis
species
0.006
0.41
294.3
1881
771
Lachnospira pectinoschiza
species
0.162
2.18
293.4
1260
2744
Sporotomaculum
genus
0.004
0.38
268.1
1329
500
Oribacterium
genus
0.035
2.14
264.9
1145
2451
Slackia
genus
0.0465
0.47
256.2
2336
1094
Oribacterium sinus
species
0.035
2.11
255.9
1151
2432
Luteolibacter
genus
0.017
0.39
243.3
1238
479
Luteolibacter algae
species
0.017
0.39
238.1
1227
479
Collinsella intestinalis
species
0.009
0.41
234.5
1330
542
Collinsella
genus
0.108
0.48
233.8
2126
1011
Blautia obeum
species
0.10995
1.98
223.4
1271
2520
Lachnobacterium
genus
0.03
1.92
202
1284
2463
Johnsonella ignava
species
0.0429
0.53
200.3
2571
1356
Johnsonella
genus
0.0429
0.53
199.5
2571
1358
Eggerthella sinensis
species
0.006
0.44
196.6
1296
574
Adlercreutzia equolifaciens
species
0.013
0.49
191
1674
814
Pontibacter
genus
0.004
0.42
190.9
1085
456
Pontibacter niistensis
species
0.004
0.42
189.6
1082
456
More or Less often based on Symptom Median High Incidence
Above we see that many of the top bacteria identified are sparse, that is not reported often. We then restrict them to those that occur above 50% or the time.
None were found
More or Less often based on Reference Median High Incidence
Above we see that many of the top bacteria identified are sparse, that is not reported often. We then restrict them to those that occur above 50% or the time.
tax_name
Rank
Reference Median Freq
Odds Ratio
Chi2
Below
Above
Phocaeicola dorei
species
0.038
2.32
335.2
1171
2721
Corynebacterium
genus
0.012
0.32
324.4
1279
413
Odoribacter denticanis
species
0.006
0.41
294.3
1881
771
Lachnospira pectinoschiza
species
0.162
2.18
293.4
1260
2744
Sporotomaculum
genus
0.004
0.38
268.1
1329
500
Oribacterium
genus
0.035
2.14
264.9
1145
2451
Slackia
genus
0.0465
0.47
256.2
2336
1094
Oribacterium sinus
species
0.035
2.11
255.9
1151
2432
Luteolibacter
genus
0.017
0.39
243.3
1238
479
Luteolibacter algae
species
0.017
0.39
238.1
1227
479
Collinsella intestinalis
species
0.009
0.41
234.5
1330
542
Collinsella
genus
0.108
0.48
233.8
2126
1011
Blautia obeum
species
0.10995
1.98
223.4
1271
2520
Lachnobacterium
genus
0.03
1.92
202
1284
2463
Johnsonella ignava
species
0.0429
0.53
200.3
2571
1356
Johnsonella
genus
0.0429
0.53
199.5
2571
1358
Eggerthella sinensis
species
0.006
0.44
196.6
1296
574
Adlercreutzia equolifaciens
species
0.013
0.49
191
1674
814
Pontibacter
genus
0.004
0.42
190.9
1085
456
Pontibacter niistensis
species
0.004
0.42
189.6
1082
456
Summary
A large number of bacterial taxa exhibit shifts with P < 0.01 in association with this condition. The subsequent challenge is determining how to modulate these taxa, since the volume of candidates exceeds what most individuals can practically consider. Moreover, for many of the taxa identified, there is no published evidence in the U.S. National Library of Medicine describing how to alter their abundance.
A deep optimization model, such as the one implemented on the Microbiome Taxa R2 site, can be used to inform probiotic selection. This model provides coverage for each identified taxon and infers which probiotics are most likely to shift their levels. Its output may then be integrated with more conventional recommendations derived from literature indexed in the U.S. National Library of Medicine where such evidence exists, with the two recommendation sets reconciled by giving priority to probiotic-based suggestions.
Development of a dedicated database based on Biomesight samples is in progress. The current model uses data contributed by PrecisionBiome, and datasets generated with differing laboratory processing pipelines cannot be safely combined, as discussed in The taxonomy nightmare before Christmas…. Once the Biomesight-specific database is complete, an option for generating (offline-only) personalized suggestions will be added to the Microbiome Prescription website.
Probiotics Suggestions
The following are based on a simplified algorithm using R2 data for Biomesight. These are tentative numbers subject to future refinements. Bacteria listed are only for probiotics detected with Biomesight tests. Probiotics include some that are available only in some countries and some that are pending approval for retail sale.
Good Count: Number of bacteria expected to shift in desired direction
Bad Count: Number of bacteria expected to shift in wrong direction
Impact: Estimator of impact based on Chi-2, Slope and R2 vectors
A reader asked about gluten sensitivity profile in an email. Here are the results. The short form for probiotics:
Bifidobacterium breve
Bifidobacterium longum
Bifidobacterium adolescentis
AVOID LACTOBACILLUS
This document presents the results of statistical analysis on symptoms from viable, self-annotated Biomesight microbiome samples. The methodology for data acquisition is outlined in New Standards for Microbiome Analysis?.
Tables have been refined to display only genus- and species-level taxa, the 20 most prominent entries per group, and associations achieving statistical significance (P < 0.01).
The following sections provide the processed data, accompanied by guidance on interpretation and application. Counts of significant bacterial taxa are included, reflecting the application of non-standard but rigorously validated statistical approaches to extensive sample and reference populations, where statistical power derives from dataset scale.
Significance
Genus
p < 0.01
162
p < 0.001
146
p < 0.0001
131
p < 0.00001
116
Averages and Medians
I prefer medians over averages. Medians are the values where half of the people have less and half has more. If the data was a bell-curve, then the values will almost be the same… with bacteria that happens rarely. Look at the bacterua below, we see that for some the average is above and the median below. Should one increase or decrease this bacteria?
tax_name
Rank
Symptom Average
Reference Average
Symptom Median
Reference Median
Bacteroides
genus
27.548
26
24.269
26.905
Faecalibacterium prausnitzii
species
12.695
12.196
11.329
12.474
Roseburia
genus
2.324
2.857
1.809
1.382
Lachnospira
genus
3.173
2.711
1.885
2.302
Oscillospira
genus
2.668
2.345
1.947
2.323
Bacteroides uniformis
species
2.839
2.728
1.565
1.903
Parabacteroides
genus
3.138
2.607
1.719
2.022
Clostridium
genus
2.087
1.851
1.363
1.531
Pedobacter
genus
1.315
0.988
0.552
0.706
Coprococcus
genus
1.13
1.442
0.73
0.604
Bacteroides thetaiotaomicron
species
0.943
1.077
0.464
0.59
Bifidobacterium
genus
0.352
0.955
0.129
0.028
Hathewaya histolytica
species
0.442
0.273
0.154
0.251
Hathewaya
genus
0.442
0.273
0.154
0.251
Ruminococcus bromii
species
1.039
0.783
0.167
0.262
Bacteroides cellulosilyticus
species
1.266
0.839
0.076
0.155
Bilophila
genus
0.415
0.348
0.209
0.285
Bilophila wadsworthia
species
0.393
0.34
0.199
0.262
Dorea
genus
0.329
0.488
0.295
0.242
Bacteroides rodentium
species
0.361
0.393
0.186
0.235
If symptom median is higher than reference median, it means there is more of this bacteria. If lower, then less. This ignores how often the bacteria is seen (we average only over reports). IMHO using average value instead of median will often result in a worse situation for the patient
Bacteria Incidence – How often is it reported
The common sense belief is that if a bacteria is reported more often, then the amount should be higher. This is often not true. The microbiome is a complex thing. In this case two specific probiotic species are seen rarely and thus, supplementation could be inferred.
tax_name
Rank
Incidence Odds Ratio
Chi2
Symptoms %
Reference %
Bifidobacterium breve
species
0.57
8.8
23.6
41.3
Bifidobacterium catenulatum
species
0.6
6.7
21.6
35.9
More or Less often based on Symptom Median All Incidence
This is a little more complex to understand. If we compute the mid point for people with the symptom, then if the bacteria was not involved then half of the reference should be above this value and half below this value. If not, it means that the symptom tends to over or under growth.
tax_name
Rank
Symptom Median
Odds Ratio
Chi2
Below
Above
Thiorhodococcus mannitoliphagus
species
0.002
0.2
37.9
132
27
Cystobacter
genus
0.002
0.21
37.4
131
27
Psychrobacter glacialis
species
0.002
0.36
33.8
675
243
Rickettsia marmionii Stenos et al. 2005
species
0.002
0.36
30.3
393
140
Niabella
genus
0.002
0.38
29
585
224
Viridibacillus neidei
species
0.002
0.39
27
470
182
Thiorhodococcus
genus
0.002
0.43
22.9
579
247
Thermodesulfovibrio thiophilus
species
0.002
0.44
21.5
541
236
Oenococcus
genus
0.002
0.45
20.7
614
275
Thermodesulfovibrio
genus
0.002
0.45
20.1
626
284
Helicobacter suncus
species
0.002
0.46
19.6
765
355
Viridibacillus
genus
0.002
0.5
14.8
488
244
Desulfotomaculum defluvii
species
0.003
0.56
11.6
1017
569
Alkalibacterium
genus
0.003
0.57
10.6
899
514
Sporotomaculum syntrophicum
species
0.003
0.58
10.4
1127
652
Pelagicoccus
genus
0.002
0.58
10.1
842
487
Treponema
genus
0.003
0.58
9.7
593
342
Olivibacter soli
species
0.002
0.57
9.5
457
262
Hydrogenophilus
genus
0.003
0.59
9.5
1133
671
Mycoplasma iguanae
species
0.002
0.58
9.1
458
266
More or Less often based on Reference Median All Incidence
This is like the above, but with a different line in the sand. Instead of the median of those with the condition, we use the median of the reference set.
tax_name
Rank
Reference Median
Odds Ratio
Chi2
Below
Above
Bifidobacterium
genus
0.028
2.37
347.9
1154
2736
Tetragenococcus
genus
0.004
0.44
234.4
1638
719
Bifidobacterium adolescentis
species
0.004
2.03
215.7
1074
2176
Hathewaya histolytica
species
0.2505
0.52
202.8
2568
1345
Hathewaya
genus
0.2505
0.52
202.2
2567
1346
Psychrobacter glacialis
species
0.002
0.36
168.1
675
243
Anaerotruncus
genus
0.1785
0.57
155.7
2439
1383
Caloramator uzoniensis
species
0.006
0.51
153.9
1408
712
Bifidobacterium choerinum
species
0.0055
1.87
151.9
917
1718
Mogibacterium
genus
0.022
0.57
145.4
2115
1195
Methylonatrum
genus
0.004
0.54
145
1627
872
Methylonatrum kenyense
species
0.004
0.54
145
1627
872
Anaerotruncus colihominis
species
0.1705
0.58
143
2415
1403
Hymenobacter xinjiangensis
species
0.007
0.53
137.4
1486
795
Niabella
genus
0.002
0.38
135.9
585
224
Streptococcus australis
species
0.0095
0.57
127.5
1773
1010
Leptolyngbya laminosa
species
0.0045
0.44
125.9
698
304
Leptolyngbya
genus
0.0045
0.44
125.8
701
306
Bifidobacterium longum
species
0.0195
1.73
124
1047
1814
Vagococcus
genus
0.003
0.48
119.9
841
403
More or Less often based on Symptom Median High Incidence
Above we see that many of the top bacteria identified are sparse, that is not reported often. We then restrict them to those that occur above 50% or the time.
tax_name
Rank
Symptom Median Freq
Odds Ratio
Chi2
Below
Above
Clostridium taeniosporum
species
0.003
0.6
8.9
1354
818
More or Less often based on Reference Median High Incidence
Above we see that many of the top bacteria identified are sparse, that is not reported often. We then restrict them to those that occur above 50% or the time.
tax_name
Rank
Reference Median Freq
Odds Ratio
Chi2
Below
Above
Bifidobacterium
genus
0.028
2.37
347.9
1154
2736
Tetragenococcus
genus
0.004
0.44
234.4
1638
719
Bifidobacterium adolescentis
species
0.004
2.03
215.7
1074
2176
Hathewaya histolytica
species
0.2505
0.52
202.8
2568
1345
Hathewaya
genus
0.2505
0.52
202.2
2567
1346
Psychrobacter glacialis
species
0.002
0.36
168.1
675
243
Anaerotruncus
genus
0.1785
0.57
155.7
2439
1383
Caloramator uzoniensis
species
0.006
0.51
153.9
1408
712
Bifidobacterium choerinum
species
0.0055
1.87
151.9
917
1718
Mogibacterium
genus
0.022
0.57
145.4
2115
1195
Methylonatrum
genus
0.004
0.54
145
1627
872
Methylonatrum kenyense
species
0.004
0.54
145
1627
872
Anaerotruncus colihominis
species
0.1705
0.58
143
2415
1403
Hymenobacter xinjiangensis
species
0.007
0.53
137.4
1486
795
Niabella
genus
0.002
0.38
135.9
585
224
Streptococcus australis
species
0.0095
0.57
127.5
1773
1010
Leptolyngbya laminosa
species
0.0045
0.44
125.9
698
304
Leptolyngbya
genus
0.0045
0.44
125.8
701
306
Bifidobacterium longum
species
0.0195
1.73
124
1047
1814
Vagococcus
genus
0.003
0.48
119.9
841
403
Summary
A large number of bacterial taxa exhibit shifts with P < 0.01 in association with this condition. The subsequent challenge is determining how to modulate these taxa, since the volume of candidates exceeds what most individuals can practically consider. Moreover, for many of the taxa identified, there is no published evidence in the U.S. National Library of Medicine describing how to alter their abundance.
A deep optimization model, such as the one implemented on the Microbiome Taxa R2 site, can be used to inform probiotic selection. This model provides coverage for each identified taxon and infers which probiotics are most likely to shift their levels. Its output may then be integrated with more conventional recommendations derived from literature indexed in the U.S. National Library of Medicine where such evidence exists, with the two recommendation sets reconciled by giving priority to probiotic-based suggestions.
Development of a dedicated database based on Biomesight samples is in progress. The current model uses data contributed by PrecisionBiome, and datasets generated with differing laboratory processing pipelines cannot be safely combined, as discussed in The taxonomy nightmare before Christmas…. Once the Biomesight-specific database is complete, an option for generating (offline-only) personalized suggestions will be added to the Microbiome Prescription website.
Probiotics Suggestions
The following are based on a simplified algorithm using R2 data for Biomesight. These are tentative numbers subject to future refinements. Bacteria listed are only for probiotics detected with Biomesight tests. Probiotics include some that are available only in some countries and some that are pending approval for retail sale.
Good Count: Number of bacteria expected to shift in desired direction
Bad Count: Number of bacteria expected to shift in wrong direction
Impact: Estimator of impact based on Chi-2, Slope and R2 vectors
I am going to review using the traditional analysis. My initial impression is that suggested retesting and plotting the next course correction was missed. As with sailing a boat, this can sail a person to an unintended spot. The last section is trying some work in progress on his sample(s). This is experimental work which I have high hope on yielding much finer identification of the critical bacteria that should be addressed.
Analysis
My usual starting point for multiple tests is compare forecasts of symptoms: New sample is 2025-11, old sample is 2025-03. Things have gotten worse.
I decide to compare 2025-11 to 2024-12 and see the latest sample is still worse, but not as bad. In other words, the gains made over the summer has been lost. This person is in a northern climate so seasonal variation could (theoretically) be significant.
As often, we have a high hit rate of projected symptoms against actual symptoms.
Current Back Story
The first line is reflected above.
I have not been feeling so well lately (since the last year).
I would say that my symptoms has become worse.
Earlier it has always felt as I have done some progress but the last 12 months it has been the opposite.
Earlier I got rid of my muscle and joint pain but it has come back and I have much bigger issues with my red nose and my body feels very stressed.
Also feel very bloated.
A summary of my biggest issues:
Get the red nose (some form of rosacea).
Feel fatigued (both physically and mentally).
Feeling stressed.
Brain fog.
Bloated.
Lots of gas – I fart and burps a lot.
Issues with allergies
Muscle and joint pain
For the last 4 years I’ve been eating large amounts of rye and oats.
Around 150-200 gram of rye bread every day.
Around 70 gram of oats every day.
Been eating low fat, low protein and high carb (specially from rye, oats, apple juice and potatoes) because this diet seem to reduce my symptoms.
As soon as I start to eat high meat and high fat my symptoms get worse.
Traditional Analysis
First, I am doing the “traditional” analysis before exploring some work in progress to improve suggestions further. The process is simple, pick Beginner-Symptoms, mark symptoms and get suggestions. This is the process that seems to produce the best results. Other choices are intended to satisfy people with different assumptions. The site purpose is allow people to use the data according to their beliefs about the best way.
Despite having 42 symptoms entered, this boiled down to just 20 bacteria. Many related symptoms are connected to the same bacteria.
Investigate: “As soon as I start to eat high meat and high fat my symptoms”
Which agrees with his reported response. On the other side, generic “fat” is a significant plus– so the type of fat seems to be critical.
Investigate Current Eating Habits: eating large amounts of rye and oats.
The suggestions are intended to be course corrections for the microbiome. Keeping on a course for too long may end up running aground on mudflats (instead of the original reefs that the course correction was intended for).
The question is why rye is ok and other grains are not? It may be due to some composition aspect or a side-effect of having sparse data. It looks like some change of diet is suggested.
While fighting ME/CFS, I retested about 6 weeks after getting the results of the last test. I noticed that suggestions swing back and worth a lot – but I kept following them. Often there can be a battle between “common sense beliefs” and what the algorithms find. Avoiding something during one cycle and then taking it the next cycle seemed “irrational”. I borrowed from physical processes the concept of “microbiome oscillations” and stopped worrying about the swings.
My personal advice is simple, get results and then do suggestions for 6-8 week and do another test. With test processing delays, it means about 10-12 weeks on each set of suggestions
Going Forward — and a new Algorithm
Recently I have been working on an Odds Ratio investigation. The reason is simple, the Odds ratio gives an objective measure of the importance of each bacteria for the symptoms. The new approach uses Odds Ratio to determine the odds of a bacteria causing a symptom. The odds tells me the importance. If you are interested in more technical data, see:
I will be trying it out on his data. The databases involved are about 160GB with processing often taking 20 minutes for each processing state, so they are on my “garage” high performance server (nerd talk: 64GB of memory, fast M.2 NVMe 2TB drive for disk) and strictly for research/exploration at the moment.
Key differences
we are going to estimate symptoms a different way than traditional (using odds)
we are likely to have 100+ bacteria to shift
Predicted Symptoms Rank Order
Using the Odds Ratio approach we get the following predictions that agrees with his reported symptoms/characteristics.
Symptom Name
Strength
Age: 30-40
11.2
Sleep: Unrefreshed sleep
10.9
Comorbid: Small intestinal bacterial overgrowth (SIBO)
9.1
Immune Manifestations: Inflammation (General)
9
General: Fatigue
9
DePaul University Fatigue Questionnaire : Tingling feeling
8.8
Neuroendocrine: Cold limbs (e.g. arms, legs hands)
8.5
Neuroendocrine Manifestations: cold extremities
8.3
Neurocognitive: Brain Fog
8.1
Post-exertional malaise: Worsening of symptoms after mild mental activity
8
DePaul University Fatigue Questionnaire : Fatigue
7.9
Gender: Male
7.9
DePaul University Fatigue Questionnaire : Muscle Pain (i.e., sensations of pain or aching in your muscles. This does not include weakness or pain in other areas such as joints)
7.8
Immune Manifestations: Bloating
7.5
DePaul University Fatigue Questionnaire : Allergies
7.4
DePaul University Fatigue Questionnaire : Muscle weakness
6.9
DePaul University Fatigue Questionnaire : Post-exertional malaise, feeling worse after doing activities that require either physical or mental exertion
6.7
DePaul University Fatigue Questionnaire : Rash
6.5
Post-exertional malaise: Mentally tired after the slightest effort
6.3
Comorbid: Histamine or Mast Cell issues
6.3
Post-exertional malaise: Next-day soreness after everyday activities
6
Post-exertional malaise: Muscle fatigue after mild physical activity
6
Official Diagnosis: Mast Cell Dysfunction
5.9
Neuroendocrine Manifestations: worsening of symptoms with stress.
5.9
Post-exertional malaise: Worsening of symptoms after mild physical activity
5.8
DePaul University Fatigue Questionnaire : Does physical activity make you feel worse
5.7
DePaul University Fatigue Questionnaire : Unrefreshing Sleep, that is waking up feeling tired
5.7
Immune: Flu-like symptoms
5.7
DePaul University Fatigue Questionnaire : Pain in Multiple Joints without Swelling or Redness
5.5
Neurological-Audio: hypersensitivity to noise
5.2
Immune Manifestations: Inflammation of skin, eyes or joints
5.1
Looking at the existing estimates, we see far greater separation in weight/estimates. I favor separation because that implies much better focus on bacteria.
DePaul University Fatigue Questionnaire : Pain in Multiple Joints without Swelling or Redness ✅ – [83.2%]
DePaul University Fatigue Questionnaire : Muscle weakness ✅ – [83.1%]
DePaul University Fatigue Questionnaire : Muscle Pain (i.e., sensations of pain or aching in your muscles. This does not include weakness or pain in other areas such as joints) ✅ – [82.7%]
Post-exertional malaise: Worsening of symptoms after mild physical activity ✅ – [82.4%]
Post-exertional malaise: Next-day soreness after everyday activities ✅ – [82.3%]
General: Fatigue ✅ – [82.3%]
Sleep: Unrefreshed sleep ✅ – [82.2%]
Comorbid: Small intestinal bacterial overgrowth (SIBO) ✅ – [82.1%]
Immune Manifestations: Bloating ✅ – [81.9%]
DePaul University Fatigue Questionnaire : Fatigue ✅ – [81.7%]
Official Diagnosis: Chronic Fatigue Syndrome (CFS/ME) ✅ – [81.5%]
Neurological-Audio: hypersensitivity to noise ✅ – [81.5%]
DePaul University Fatigue Questionnaire : Unrefreshing Sleep, that is waking up feeling tired ✅ – [81.4%]
DePaul University Fatigue Questionnaire : Easily irritated – [81.2%]
Neuroendocrine Manifestations: worsening of symptoms with stress. ✅ – [81.2%]
Key Bacteria identified
The new approach identifies these bacteria to target, with their relative importance (Weight). I just did another post on a ME/CFSer, Microbiome Interpretation – Questions From A User. Megamonas also was her top one.
tax name
tax rank
Weight
Target
Megamonas
genus
108.9
Too High
Klebsiella oxytoca
species
95.8
Too High
Ruminococcus bromii
species
-17.9
Too Low
Eubacteriales
order
-16.1
Too Low
Clostridia
class
-15.1
Too Low
Megamonas funiformis
species
15
Too High
Bacillota
phylum
-14.2
Too Low
Ruminococcaceae
family
-14.2
Too Low
Segatella
genus
13.6
Too High
Oscillospiraceae
family
-13.4
Too Low
Ruminococcus
genus
-12.4
Too Low
Terrabacteria group
clade
-12.4
Too Low
Segatella copri
species
11.9
Too High
Bacteroidia
class
11.4
Too High
Bacteroidales
order
11.4
Too High
Bacteroidota/Chlorobiota group
clade
10.3
Too High
Bacteroidota
phylum
10.1
Too High
FCB group
clade
9.8
Too High
Prevotella
genus
9.7
Too High
Lachnospiraceae
family
-9.3
Too Low
Prevotellaceae
family
9
Too High
Phocaeicola vulgatus
species
8.4
Too High
Akkermansiaceae
family
6.7
Too High
Bacteroides uniformis
species
6
Too High
Pseudomonadota
phylum
5.9
Too High
Gammaproteobacteria
class
5.2
Too High
Yersinia
genus
4.8
Too High
Verrucomicrobiota
phylum
4.3
Too High
Akkermansia
genus
4.1
Too High
Verrucomicrobiales
order
4
Too High
The traditional approach identifies the list below. There is relatively little overlap. My ‘gut’ reading is that those above are likely a better candidate set than those below.
Bacteria
Rank
Shift
Thiotrichales
order
High
Sharpea
genus
High
Selenomonas
genus
High
Ruminococcus
genus
High
Negativicutes
class
Low
Johnsonella
genus
High
Holdemania
genus
High
Erysipelothrix
genus
High
Dorea
genus
High
Desulfovibrionia
class
Low
delta/epsilon subdivisions
clade
Low
Cyanophyceae
class
Low
Cyanobacteriota/Melainabacteria group
clade
Low
Coprococcus
genus
High
Chlorobiota
phylum
High
Chlorobiia
class
High
Chlorobiaceae
family
High
Chlorobaculum
genus
High
Actinomycetota
phylum
Low
Actinomycetes
class
Low
Suggestions
Since two bacteria dominates, I ran the suggestion algorithm only on those two bacteria. The results are below and very similar to the results from the traditional approach. “All algorithms lead to the same suggestions”. Doing the full list cited above, produced very similar suggestions.
Modifier
Net
fruit/legume fibre
263
fruit
241
Fiber, total dietary
217
Chitosan
217
Slow digestible carbohydrates. {Low Glycemic}
210
oolong teas
205
polyphenols
203
resveratrol-pterostilbene x Quercetin {quercetin x resveratrol}
First I used only the top two bacteria to see what is suggested with a very targeted set.
Bacillus subtilis 75
Lactobacillus jensenii 60
Below are pushing the full set of identified bacteria through BiomeSight R2 matrix, then filtered to positive impact with no risk. Escherichia coli (cited above) continues to be a take. Bacillus subtilis would be my fall back suggestion for a probiotic. It is marginally negative on the consensus report and not cited on other R2 suggestion list. For others candidates
Lactobacillus jensenii was one for and no comment
Lactococcus lactis is a one for and one against
Lactobacillus helveticus is one strong against and no comment
Lacticaseibacillus casei is one strong against and no comment
Akkermansia muciniphila is two strong avoid
I tend to do a variation of the traditional “Do no harm”, minimize the risk of adverse shifts.
Probiotic
Net Impact
Good Count
Bad Count
Bacillus subtilis
81.9
5
0
Lactobacillus jensenii
68.5
2
0
Lactococcus lactis
26.8
2
0
Lactobacillus helveticus
21.4
4
0
Lacticaseibacillus casei
21.4
2
0
Segatella copri
21.2
3
0
Lactiplantibacillus pentosus
21
5
0
Akkermansia muciniphila
18.7
4
0
Bacillus amyloliquefaciens group
18.3
1
0
Enterococcus faecium
16.3
1
0
Limosilactobacillus fermentum
13.6
1
0
Heyndrickxia coagulans
13.4
3
0
Enterococcus durans
12.4
2
0
Pediococcus acidilactici
11
1
0
Enterococcus faecalis
10.6
2
0
Leuconostoc mesenteroides
10.5
1
0
Escherichia coli
4.3
3
0
Bottom Line
The purpose of this post was to evaluate suggestions for a regular reader. The secondary goal was to see how well a new approach that I am developing is working. This new approach produces different targeted bacteria with very similar suggestions generated, the most significance difference is far more targeted probiotics for the symptoms based on the same lab data.
The one interesting aspect is that the key bacteria (just 2) were clearly identified. These two bacteria alone produced suggestions similar to the bigger bacteria selection. I do like this narrow bacteria selection of key bacteria and will likely do a few more samples to further explore things.
Follow Up
I decided to look at all of his samples with the new algorithm to look for patterns. Megamonas stands out as the one that most frequently appears and disappears. Klebsiella oxytoca and Morganellaceae are the next candidates.
Upload Date
Top Bacteria
2021-09-24
Megamonas genus 108.9 Too High Lachnospiraceae family -56.2 Too Low Eubacteriales order -47.3 Too Low Bacillota phylum -46.6 Too Low Clostridia class -46.4 Too Low Terrabacteria group clade -44.8 Too Low
2021-09-24
Bacillota phylum -46.5 Too Low Eubacteriales order -45.1 Too Low Terrabacteria group clade -45 Too Low Clostridia class -44.1 Too Low Lachnospiraceae family -43.6 Too Low
2022-04-19
Klebsiella oxytoca species 95.8 Too High Morganellaceae family 91 Too High
2022-09-04
Oscillospiraceae family 17.7 Too High Ruminococcaceae family 17.4 Too High Bacteroidaceae family -16 Too Low Bacteroides genus -15.9 Too Low
2023-03-15
Megamonas genus 108.9 Too High Lachnospiraceae family -26 Too Low
2023-09-26
Megamonas genus 108.9 Too High
2024-02-13
Bacteroidaceae family -27.3 Too Low Bacteroides genus -27.3 Too Low Phocaeicola dorei species -21.4 Too Low
2024-09-25
Segatella genus 13.6 Too High Segatella copri species 11.9 Too High
2025-04-22
Morganellaceae family 91.6 Too High
2025-12-08
Megamonas genus 108.9 Too High Klebsiella oxytoca species 95.8 Too High
This document presents the results of statistical analysis on symptoms from viable, self-annotated Biomesight microbiome samples. The methodology for data acquisition is outlined in New Standards for Microbiome Analysis?.
In my weekly review, I noticed this new study: “Analysis of gut microbiota in Restless Legs Syndrome: searching for a metagenomic signature” Dec 2025 That identifies “a statistically significant decrease in the abundance of Lachnoclostridium and Flavonifractor genera in RLS compared to CTRL“. Just two bacteria. I was surprised to see so few reported. Below you will see my results (all all of the source data is available for download for those that wish to verify the numbers). I was able to get 137 significant shifts
Tables have been refined to display only genus- and species-level taxa, the 20 most prominent entries per group, and associations achieving statistical significance (P < 0.01).
The following sections provide the processed data, accompanied by guidance on interpretation and application. Counts of significant bacterial taxa are included, reflecting the application of non-standard but rigorously validated statistical approaches to extensive sample and reference populations, where statistical power derives from dataset scale.
Significance
Genus
p < 0.01
137
p < 0.001
126
p < 0.0001
119
p < 0.00001
103
Averages and Medians
I prefer medians over averages. Medians are the values where half of the people have less and half has more. If the data was a bell-curve, then the values will almost be the same… with bacteria that happens rarely. Look at the bacterua below, we see that for some the average is above and the median below. Should one increase or decrease this bacteria?
If symptom median is higher than reference median, it means there is more of this bacteria. If lower, then less. This ignores how often the bacteria is seen (we average only over reports). IMHO using average value instead of median will often result in a worse situation for the patient
tax_name
Rank
Symptom Avarage
Reference Average
Symptom Median
Reference Median
Bacteroides
genus
26.797
26.017
24.337
28.038
Phocaeicola
genus
10.593
10.852
9.365
10.564
Bacteroides uniformis
species
2.92
2.724
1.555
2.385
Ruminococcus
genus
6.675
5.576
4.377
4.823
Clostridium
genus
2.042
1.855
1.36
1.803
Oscillospira
genus
2.898
2.345
1.952
2.313
Parabacteroides
genus
2.741
2.622
1.723
2.016
Bacteroides cellulosilyticus
species
1.359
0.843
0.075
0.312
Parabacteroides merdae
species
0.823
0.745
0.298
0.531
Pedobacter
genus
1.05
0.999
0.553
0.742
Coprococcus
genus
1.193
1.438
0.735
0.558
Sutterella
genus
1.369
1.651
1.251
1.095
Roseburia faecis
species
1.282
1.205
0.573
0.709
Novispirillum
genus
0.845
0.866
0.091
0.225
Insolitispirillum
genus
0.845
0.867
0.093
0.222
Insolitispirillum peregrinum
species
0.845
0.867
0.093
0.222
Ruminococcus bromii
species
1.015
0.784
0.169
0.292
Blautia coccoides
species
0.726
0.915
0.593
0.47
Caloramator
genus
1.013
0.937
0.103
0.211
Blautia hansenii
species
1.19
1.035
0.717
0.824
Bacteria Incidence – How often is it reported
The common sense belief is that if a bacteria is reported more often, then the amount should be higher. This is often not true. The microbiome is a complex thing.
Nothing significant was found
More or Less often based on Symptom Median All Incidence
This is a little more complex to understand. If we compute the mid point for people with the symptom, then if the bacteria was not involved then half of the reference should be above this value and half below this value. If not, it means that the symptom tends to over or under growth.
tax_name
Rank
Symptom Median
Odds Ratio
Chi2
Below
Above
Streptococcus ursoris
species
0.002
0.26
21.6
98
25
Actinopolymorpha
genus
0.002
0.35
17.4
150
52
Actinopolymorpha rutila
species
0.002
0.34
17.3
138
47
Helicobacter suncus
species
0.002
0.47
13.1
771
363
Thermodesulfovibrio
genus
0.002
0.47
13.1
627
293
Desulfotomaculum defluvii
species
0.003
0.55
8.5
1037
569
Bacteroides helcogenes
species
0.002
0.44
8.5
80
35
Bifidobacterium pullorum
species
0.002
0.49
8.3
139
68
Hydrogenophilus
genus
0.003
0.58
7.2
1162
670
Pelagicoccus
genus
0.002
0.58
6.9
850
493
Sporotomaculum syntrophicum
species
0.003
0.58
6.8
1134
663
More or Less often based on Reference Median All Incidence
This is like the above, but with a different line in the sand. Instead of the median of those with the condition, we use the median of the reference set.
tax_name
Rank
Reference Median
Odds Ratio
Chi2
Below
Above
Caldicellulosiruptor
genus
0.027
0.46
279.5
2572
1189
Bifidobacterium longum
species
0.012
2.23
257.1
891
1990
Hymenobacter xinjiangensis
species
0.008
0.43
239.6
1608
696
Hymenobacter
genus
0.008
0.47
223.6
1832
854
Thermicanus
genus
0.189
0.5
211.1
2254
1135
Bifidobacterium gallicum
species
0.0035
2.21
204.6
654
1448
Anaerotruncus colihominis
species
0.178
0.53
201
2532
1331
Bacteroides cellulosilyticus
species
0.312
0.53
191.2
2463
1311
Candidatus Glomeribacter
genus
0.004
0.46
179.2
1282
592
Anaerotruncus
genus
0.18
0.55
170.6
2488
1379
Segatella
genus
0.016
1.8
167.3
1347
2426
Staphylococcus
genus
0.004
0.43
167.3
943
402
Erysipelothrix
genus
0.0165
0.55
167.2
2231
1220
Porphyromonas
genus
0.013
0.55
165.7
2172
1185
Erysipelothrix muris
species
0.015
0.55
158.9
2186
1211
Clostridium
genus
1.803
0.57
158.3
2551
1454
Emticicia oligotrophica
species
0.007
0.54
156.7
1944
1057
Caloramator uzoniensis
species
0.0065
0.51
155.5
1416
716
Emticicia
genus
0.007
0.55
154
1942
1062
Bifidobacterium choerinum
species
0.005
1.86
151.4
927
1728
More or Less often based on Symptom Median High Incidence
Above we see that many of the top bacteria identified are sparse, that is not reported often. We then restrict them to those that occur above 50% or the time.
Per above, nothing was found
More or Less often based on Reference Median High Incidence
Above we see that many of the top bacteria identified are sparse, that is not reported often. We then restrict them to those that occur above 50% or the time.
tax_name
Rank
Reference Median Freq
Odds Ratio
Chi2
Below
Above
Caldicellulosiruptor
genus
0.027
0.46
279.5
2572
1189
Bifidobacterium longum
species
0.012
2.23
257.1
891
1990
Hymenobacter xinjiangensis
species
0.008
0.43
239.6
1608
696
Hymenobacter
genus
0.008
0.47
223.6
1832
854
Thermicanus
genus
0.189
0.5
211.1
2254
1135
Bifidobacterium gallicum
species
0.0035
2.21
204.6
654
1448
Anaerotruncus colihominis
species
0.178
0.53
201
2532
1331
Bacteroides cellulosilyticus
species
0.312
0.53
191.2
2463
1311
Candidatus Glomeribacter
genus
0.004
0.46
179.2
1282
592
Anaerotruncus
genus
0.18
0.55
170.6
2488
1379
Segatella
genus
0.016
1.8
167.3
1347
2426
Staphylococcus
genus
0.004
0.43
167.3
943
402
Erysipelothrix
genus
0.0165
0.55
167.2
2231
1220
Porphyromonas
genus
0.013
0.55
165.7
2172
1185
Erysipelothrix muris
species
0.015
0.55
158.9
2186
1211
Clostridium
genus
1.803
0.57
158.3
2551
1454
Emticicia oligotrophica
species
0.007
0.54
156.7
1944
1057
Caloramator uzoniensis
species
0.0065
0.51
155.5
1416
716
Emticicia
genus
0.007
0.55
154
1942
1062
Bifidobacterium choerinum
species
0.005
1.86
151.4
927
1728
Summary
A large number of bacterial taxa exhibit shifts with P < 0.01 in association with this condition. The subsequent challenge is determining how to modulate these taxa, since the volume of candidates exceeds what most individuals can practically consider. Moreover, for many of the taxa identified, there is no published evidence in the U.S. National Library of Medicine describing how to alter their abundance.
A deep optimization model, such as the one implemented on the Microbiome Taxa R2 site, can be used to inform probiotic selection. This model provides coverage for each identified taxon and infers which probiotics are most likely to shift their levels. Its output may then be integrated with more conventional recommendations derived from literature indexed in the U.S. National Library of Medicine where such evidence exists, with the two recommendation sets reconciled by giving priority to probiotic-based suggestions.
Development of a dedicated database based on Biomesight samples is in progress. The current model uses data contributed by PrecisionBiome, and datasets generated with differing laboratory processing pipelines cannot be safely combined, as discussed in The taxonomy nightmare before Christmas…. Once the Biomesight-specific database is complete, an option for generating (offline-only) personalized suggestions will be added to the Microbiome Prescription website.
Probiotics Suggestions
The following are based on a simplified algorithm using R2 data for Biomesight. These are tentative numbers subject to future refinements. Bacteria listed are only for probiotics detected with Biomesight tests. Probiotics include some that are available only in some countries and some that are pending approval for retail sale.
Good Count: Number of bacteria expected to shift in desired direction
Bad Count: Number of bacteria expected to shift in wrong direction
Impact: Estimator of impact based on Chi-2, Slope and R2 vectors
A reader wrote the following to me. This post and associate video is an attempt to answer.
When I compare my first two analyses from Biomesight under “Multiple Samples,” the distribution of bacteria improves toward normal—assuming that the reduction in “Lab Read Quality” from 39.3 to 23.5 does not mean that the latest sample is a false positive. I have read your article “Lab Quality Versus Bacteria Reported,” but I am too brain fogged to really understand the content.
In fact, “Symptom Pattern Matching” states that there was only one improvement and 150 deteriorations. Subjectively, I feel differently, not really better, but not much worse either. That’s why I don’t know how to interpret these results. (Better: nausea, migraine, constipation—Worse: brain fog, fatigue, sleep, muscle strength. So, speculation that: MCAS is improving, but ME-CFS continues to progressively worsen).
The suggestions under “To Avoid” have changed under “Food.” It is interesting to note that, before I was aware of these suggestions, they were already reflected in my appetite or aversion to certain foods; so it is reassuring that my body perception actually corresponds to the measured facts and the statistically supported conclusions.
Unfortunately, my subjective perception of a change, but not an improvement, would then also correspond with the “outside ranges” and “symptom pattern matching.” (Objectively, I measure heart rate variability, pulse, and temperature with a simple GARMIN device and thermometer.)
I don’t know enough about statistics and am not fully mentally present, so I would be grateful if you could provide a few assessments of the measured changes, if you have the time.
With two or more samples, the ability to compare samples using symptom forecasts is intended to give a good indicator of change. In most cases, there is significant improvement. In this case, things became worse.
There can be many causes:
Catching a virus, food poisoning, etc between samples
Ignoring the “Avoids” – items that feed the bad bacteria
Trying to follow two sets of advice that have not been reconcilled
A health consultant and microbiome prescription suggestions.
“Feeling the same” with these minor shifts is not unexpected. Remembering how you were tend to be unreliable; bad memories fail fast.
Getting Suggestions is Easy, Picking Bacteria is not
Microbiome Prescription is constantly update on what influence bacteria from new studies every week. At present if has a 7,432,372 Modifier-to-Bacteria relationships in its database. Given a set of bacteria, their shifts and the relative importance of each bacteria, the suggestions are a relatively simple computation.
Picking Bacteria
If you go to the typical alternative health practitioners, or just ask on line, you may not need to get a microbiome tests. From your symptoms, they will speculate on the issue and give suggestions that they will swear works. In reality, they may appear to work because the patients that they worked for, will come back to see them again. For those where it does not work, they will move on to the next “expert”.
Testing labs will often provide a reference range for some bacteria and thus identify if you have too much or too low. There are many technical issues using these. Personally, I avoid using them — but to make people happy, several are provided on the site (Old UI).
The Simple UI gives a few canned choices for selecting the bacteria and then does the easy part, computing suggestions. The numbers of bacteria vary greatly.
A new algorithm in development, identified 2 very critical bacteria (HIGH WEIGHT) and 20 minor bacteria. The goal of the new algorithm is to better pinpointing the key bacteria and their impact.to look
Both Samples had the same top item
Megamonas, genus, weight 109, too high on both tests
Morganellaceae, famiy, weight 92, too high on latest test only,
The addition of Morganellaceae in the latest sample may account for the worse report.
Going forward, I would look at what decreases these two bacteria. I ran your latest data through the suggestion algorithm and attach the full set of suggestions in excel.
This document presents the results of statistical analysis on symptoms from viable, self-annotated Biomesight microbiome samples. The methodology for data acquisition is outlined in New Standards for Microbiome Analysis?.
Tables have been refined to display only genus- and species-level taxa, the 20 most prominent entries per group, and associations achieving statistical significance (P < 0.01).
The following sections provide the processed data, accompanied by guidance on interpretation and application. Counts of significant bacterial taxa are included, reflecting the application of non-standard but rigorously validated statistical approaches to extensive sample and reference populations, where statistical power derives from dataset scale.
Significance
Genus
p < 0.01
177
p < 0.001
160
p < 0.0001
138
p < 0.00001
124
Averages and Medians
I prefer medians over averages. Medians are the values where half of the people have less and half has more. If the data was a bell-curve, then the values will almost be the same… with bacteria that happens rarely. Look at Faecalibacterium prausnitzii is below, we see that the average is above and the median below.
If symptom median is higher than reference median, it means there is more of this bacteria. If lower, then less. This ignores how often the bacteria is seen (we average only over reports).
tax_name
Rank
Symptom Avarage
Reference Average
Symptom Median
Reference Median
Faecalibacterium prausnitzii
species
10.366
12.277
11.415
9.08
Faecalibacterium
genus
10.881
12.843
12.131
9.826
Lachnospira
genus
2.401
2.738
1.9
1.418
Coprococcus
genus
1.071
1.443
0.737
0.428
Phocaeicola dorei
species
2.699
2.916
0.418
0.128
Parabacteroides
genus
2.385
2.634
1.724
1.989
Clostridium
genus
2.005
1.854
1.359
1.6
Roseburia faecis
species
0.951
1.215
0.576
0.457
Bacteroides caccae
species
1.59
0.852
0.286
0.402
Mediterraneibacter
genus
0.805
0.713
0.277
0.381
Bacteroides thetaiotaomicron
species
1.104
1.071
0.463
0.561
Lachnospira pectinoschiza
species
0.547
0.667
0.336
0.249
Bifidobacterium
genus
0.761
0.94
0.127
0.042
Bacteroides cellulosilyticus
species
1.396
0.836
0.076
0.151
Blautia wexlerae
species
0.869
0.569
0.314
0.386
Bilophila
genus
0.343
0.35
0.21
0.278
Anaerotruncus
genus
0.284
0.184
0.136
0.203
Akkermansia muciniphila
species
2.398
1.325
0.05
0.117
Akkermansia
genus
2.398
1.325
0.051
0.117
Anaerotruncus colihominis
species
0.259
0.173
0.133
0.198
Bacteria Incidence – How often is it reported
The common sense belief is that if a bacteria is reported more often, then the amount should be higher. This is often not true. The microbiome is a complex thing. Look at Bacteroides uniformis below, we see that the average is above and the median below
tax_name
Rank
Incidence Odds Ratio
Chi2
Symptoms %
Reference %
Actinobacillus porcinus
species
0.61
6.9
24.5
40.2
Slackia faecicanis
species
1.53
7.8
44.8
29.2
Mogibacterium vescum
species
1.79
11.5
32.2
18
More or Less often based on Symptom Median All Incidence
This is a little more complex to understand. If we compute the mid point for people with the symptom, then if the bacteria was not involved then half of the reference should be above this value and half below this value. If not, it means that the symptom tends to over or under growth.
Psychrobacter glacialis
species
0.002
0.37
30.5
664
247
Niabella
genus
0.002
0.39
27.4
583
226
Thermoanaerobacterium
genus
0.002
0.4
24.4
485
195
Chromatium
genus
0.002
0.41
24.2
508
206
Chromatium weissei
species
0.002
0.41
24.1
507
206
Thermoanaerobacterium islandicum
species
0.002
0.41
23.6
478
195
Syntrophomonas sapovorans
species
0.002
0.42
22.5
536
226
Sporosarcina pasteurii
species
0.002
0.42
21.9
440
184
Thermodesulfovibrio thiophilus
species
0.002
0.43
21
543
236
Sporosarcina
genus
0.002
0.43
20.6
444
191
Oenococcus
genus
0.002
0.45
20.1
609
272
Thermodesulfovibrio
genus
0.002
0.45
19.5
629
285
Helicobacter suncus
species
0.002
0.47
18.3
768
361
Desulfofundulus
genus
0.002
0.46
18.2
496
227
Herbaspirillum magnetovibrio
species
0.002
0.51
13.6
447
226
Streptococcus infantis
species
0.003
0.54
12
804
437
Sphingomonas
genus
0.002
0.53
11.9
457
242
Desulfotomaculum defluvii
species
0.003
0.56
11.3
1022
570
Alkalibacterium
genus
0.003
0.57
10.5
906
514
Hydrogenophilus
genus
0.003
0.58
10.2
1149
662
More or Less often based on Reference Median All Incidence
This is like the above, but with a different line in the sand. Instead of the median of those with the condition, we use the median of the reference set.
tax_name
Rank
Reference Median
Odds Ratio
Chi2
Below
Above
Methylonatrum
genus
0.005
0.35
374.2
1861
655
Methylonatrum kenyense
species
0.005
0.35
374.2
1861
655
Anaerotruncus colihominis
species
0.198
0.41
365.1
2712
1113
Anaerotruncus
genus
0.203
0.42
340.3
2688
1141
Odoribacter denticanis
species
0.006
0.41
291
1856
760
Luteolibacter
genus
0.017
0.38
245.6
1225
468
Luteolibacter algae
species
0.017
0.39
240.4
1214
468
Finegoldia
genus
0.0115
0.41
212.1
1210
501
Anaerococcus
genus
0.012
0.4
206.3
1099
444
Eggerthella sinensis
species
0.006
0.44
197.2
1289
568
Finegoldia magna
species
0.008
0.4
195.4
1014
408
Coprococcus
genus
0.4285
1.87
191.4
1379
2577
Desulfovibrio fairfieldensis
species
0.0395
0.4
175.1
868
347
Mogibacterium
genus
0.023
0.54
170.4
2154
1159
Bifidobacterium
genus
0.04245
1.8
169.2
1390
2505
Rubritalea
genus
0.004
0.43
168.7
969
415
Bifidobacterium longum
species
0.016
1.9
167.6
986
1876
Lysobacter
genus
0.004
0.36
164.9
657
236
Porphyromonas
genus
0.013
0.54
164.7
2156
1174
Psychrobacter glacialis
species
0.002
0.37
158
664
247
More or Less often based on Symptom Median High Incidence
Above we see that many of the top bacteria identified are sparse, that is not reported often. We then restrict them to those that occur above 50% or the time.
tax_name
Rank
Symptom Median Freq
Odds Ratio
Chi2
Below
Above
Clostridium taeniosporum
species
0.003
0.6
8.6
1359
821
More or Less often based on Reference Median High Incidence
Above we see that many of the top bacteria identified are sparse, that is not reported often. We then restrict them to those that occur above 50% or the time.
tax_name
Rank
Reference Median Freq
Odds Ratio
Chi2
Below
Above
Methylonatrum
genus
0.005
0.35
374.2
1861
655
Methylonatrum kenyense
species
0.005
0.35
374.2
1861
655
Anaerotruncus colihominis
species
0.198
0.41
365.1
2712
1113
Anaerotruncus
genus
0.203
0.42
340.3
2688
1141
Odoribacter denticanis
species
0.006
0.41
291
1856
760
Luteolibacter
genus
0.017
0.38
245.6
1225
468
Luteolibacter algae
species
0.017
0.39
240.4
1214
468
Finegoldia
genus
0.0115
0.41
212.1
1210
501
Anaerococcus
genus
0.012
0.4
206.3
1099
444
Eggerthella sinensis
species
0.006
0.44
197.2
1289
568
Finegoldia magna
species
0.008
0.4
195.4
1014
408
Coprococcus
genus
0.4285
1.87
191.4
1379
2577
Desulfovibrio fairfieldensis
species
0.0395
0.4
175.1
868
347
Mogibacterium
genus
0.023
0.54
170.4
2154
1159
Bifidobacterium
genus
0.04245
1.8
169.2
1390
2505
Rubritalea
genus
0.004
0.43
168.7
969
415
Bifidobacterium longum
species
0.016
1.9
167.6
986
1876
Lysobacter
genus
0.004
0.36
164.9
657
236
Porphyromonas
genus
0.013
0.54
164.7
2156
1174
Psychrobacter glacialis
species
0.002
0.37
158
664
247
Summary
A large number of bacterial taxa exhibit shifts with P < 0.01 in association with this condition. The subsequent challenge is determining how to modulate these taxa, since the volume of candidates exceeds what most individuals can practically consider. Moreover, for many of the taxa identified, there is no published evidence in the U.S. National Library of Medicine describing how to alter their abundance.
A deep optimization model, such as the one implemented on the Microbiome Taxa R2 site, can be used to inform probiotic selection. This model provides coverage for each identified taxon and infers which probiotics are most likely to shift their levels. Its output may then be integrated with more conventional recommendations derived from literature indexed in the U.S. National Library of Medicine where such evidence exists, with the two recommendation sets reconciled by giving priority to probiotic-based suggestions.
Development of a dedicated database based on Biomesight samples is in progress. The current model uses data contributed by PrecisionBiome, and datasets generated with differing laboratory processing pipelines cannot be safely combined, as discussed in The taxonomy nightmare before Christmas…. Once the Biomesight-specific database is complete, an option for generating (offline-only) personalized suggestions will be added to the Microbiome Prescription website.
Probiotics Suggestions
The following are based on a simplified algorithm using R2 data for Biomesight. These are tentative numbers subject to future refinements. Bacteria listed are only for probiotics detected with Biomesight tests. Probiotics include some that are available only in some countries and some that are pending approval for retail sale.
Good Count: Number of bacteria expected to shift in desired direction
Bad Count: Number of bacteria expected to shift in wrong direction
Impact: Estimator of impact based on Chi-2, Slope and R2 vectors
This document presents the results of statistical analysis on symptoms from viable, self-annotated Biomesight microbiome samples. The methodology for data acquisition is outlined in New Standards for Microbiome Analysis?.
Tables have been refined to display only genus- and species-level taxa, the 20 most prominent entries per group, and associations achieving statistical significance (P < 0.01).
The following sections provide the processed data, accompanied by guidance on interpretation and application. Counts of significant bacterial taxa are included, reflecting the application of non-standard but rigorously validated statistical approaches to extensive sample and reference populations, where statistical power derives from dataset scale.
Significance
Genus
p < 0.01
226
p < 0.001
199
p < 0.0001
176
p < 0.00001
157
Averages and Medians
I prefer medians over averages. Medians are the values where half of the people have less and half has more. If the data was a bell-curve, then the values will almost be the same… with bacteria that happens rarely. Look at Bacteroides below, we see that the average is above and the median below.
If symptom median is higher than reference median, it means there is more of this bacteria. If lower, then less. This ignores how often the bacteria is seen (we average only over reports).
tax_name
Rank
Symptom Avarage
Reference Average
Symptom Median
Reference Median
Bacteroides
genus
28.633
25.842
24.114
27.576
Phocaeicola vulgatus
species
6.593
5.744
3.347
4.644
Phocaeicola
genus
11.777
10.78
9.291
10.397
Bacteroides uniformis
species
3.031
2.707
1.52
2.104
Parabacteroides
genus
2.552
2.631
1.714
2.058
Bacteroides thetaiotaomicron
species
1.27
1.056
0.455
0.678
Clostridium
genus
2.004
1.847
1.352
1.569
Oscillospira
genus
2.45
2.348
1.944
2.144
Bacteroides cellulosilyticus
species
1.032
0.84
0.07
0.237
Parabacteroides merdae
species
0.854
0.737
0.287
0.44
Coprococcus
genus
1.071
1.461
0.739
0.59
Pedobacter
genus
1.232
0.98
0.548
0.695
Novispirillum
genus
0.816
0.872
0.087
0.229
Insolitispirillum
genus
0.816
0.873
0.089
0.229
Insolitispirillum peregrinum
species
0.816
0.873
0.089
0.229
Bacteroides caccae
species
1.135
0.854
0.281
0.38
Bifidobacterium
genus
0.513
0.969
0.134
0.048
Bilophila
genus
0.395
0.347
0.206
0.276
Parabacteroides goldsteinii
species
0.565
0.571
0.13
0.194
Bilophila wadsworthia
species
0.376
0.339
0.197
0.256
Bacteria Incidence – How often is it reported
The common sense belief is that if a bacteria is reported more often, then the amount should be higher. This is often not true. The microbiome is a complex thing. Look at Bacteroides uniformis below, we see that the average is above and the median below
tax_name
Rank
Incidence Odds Ratio
Chi2
Symptoms %
Reference %
Bifidobacterium catenulatum
species
0.69
8.3
25.2
36.2
Thiomonas thermosulfata
species
1.41
8
29.4
20.9
Aggregatibacter
genus
0.65
7.8
16
24.4
Desulfurispirillum
genus
1.45
8.4
25.5
17.5
Desulfurispirillum alkaliphilum
species
1.45
8.1
25.2
17.4
Actinobacillus pleuropneumoniae
species
0.6
8.4
11
18.5
Bifidobacterium cuniculi
species
0.62
7.8
12
19.3
Desulfonatronovibrio
genus
1.48
7.5
19.9
13.5
Erysipelothrix inopinata
species
1.47
7.4
19.9
13.5
Paraprevotella xylaniphila
species
1.6
9.2
16.6
10.4
Candidatus Phytoplasma phoenicium
species
1.59
8.7
16
10.1
Trichodesmium
genus
1.56
6.6
12.9
8.3
More or Less often based on Symptom Median All Incidence
This is a little more complex to understand. If we compute the mid point for people with the symptom, then if the bacteria was not involved then half of the reference should be above this value and half below this value. If not, it means that the symptom tends to over or under growth.
tax_name
Rank
Symptom Median
Odds Ratio
Chi2
Below
Above
Alcanivorax
genus
0.002
0.26
75.2
375
98
Isoalcanivorax
genus
0.002
0.26
74.5
365
95
Isoalcanivorax indicus
species
0.002
0.26
74.5
365
95
Nostoc flagelliforme
species
0.002
0.27
67.3
316
84
Salidesulfovibrio
genus
0.002
0.3
63.2
381
115
Salidesulfovibrio brasiliensis
species
0.002
0.3
63.2
381
115
Niabella aurantiaca
species
0.002
0.34
62.1
524
176
Mycoplasmopsis lipophila
species
0.002
0.27
61.2
277
75
Psychroflexus
genus
0.002
0.3
60.4
348
105
Psychroflexus gondwanensis
species
0.002
0.3
60.4
348
105
Deferribacter autotrophicus
species
0.002
0.31
59.6
374
117
Pelagicoccus croceus
species
0.002
0.32
59.2
380
120
Deferribacter
genus
0.002
0.32
59
377
119
Psychrobacter glacialis
species
0.002
0.37
55.3
636
238
Thermodesulfatator atlanticus
species
0.002
0.3
53.6
276
83
Thermodesulfatator
genus
0.002
0.3
53.6
276
83
Segetibacter aerophilus
species
0.002
0.34
53.1
364
122
Bacillus ferrariarum
species
0.002
0.34
52.1
356
120
Niabella
genus
0.002
0.38
51.8
560
212
Rickettsia marmionii Stenos et al. 2005
species
0.002
0.35
51.6
379
131
More or Less often based on Reference Median All Incidence
This is like the above, but with a different line in the sand. Instead of the median of those with the condition, we use the median of the reference set.
tax_name
Rank
Reference Median
Odds Ratio
Chi2
Below
Above
Psychrobacter glacialis
species
0.002
0.37
150
636
238
Niabella aurantiaca
species
0.002
0.34
148.2
524
176
Desulfotomaculum
genus
0.004
0.51
147.5
1394
711
Alcanivorax
genus
0.002
0.26
145.8
375
98
Isoalcanivorax
genus
0.002
0.26
142.8
365
95
Isoalcanivorax indicus
species
0.002
0.26
142.8
365
95
Niabella
genus
0.002
0.38
132.4
560
212
Salidesulfovibrio
genus
0.002
0.3
127.5
381
115
Salidesulfovibrio brasiliensis
species
0.002
0.3
127.5
381
115
Bacteroides cellulosilyticus
species
0.237
0.59
127.2
2243
1325
Actinopolyspora
genus
0.002
0.38
125.5
524
198
Bifidobacterium
genus
0.048
1.68
125.3
1392
2332
Nostoc flagelliforme
species
0.002
0.27
122.8
316
84
Geobacillus
genus
0.003
0.43
122.4
672
291
Bacteroides heparinolyticus
species
0.003
0.49
122.1
928
454
Erysipelothrix muris
species
0.014
0.59
121.6
2029
1195
Pelagicoccus croceus
species
0.002
0.32
120.7
380
120
Deferribacter autotrophicus
species
0.002
0.31
120.3
374
117
Deferribacter
genus
0.002
0.32
119.9
377
119
Psychroflexus
genus
0.002
0.3
117.5
348
105
More or Less often based on Symptom Median High Incidence
Above we see that many of the top bacteria identified are sparse, that is not reported often. We then restrict them to those that occur above 50% or the time.
tax_name
Rank
Symptom Median Freq
Odds Ratio
Chi2
Below
Above
Clostridium taeniosporum
species
0.003
0.62
16
1295
805
Tetragenococcus doogicus
species
0.003
0.67
11.5
1316
881
Dethiosulfovibrio
genus
0.004
0.67
11.3
1457
981
Hydrocarboniphaga daqingensis
species
0.004
0.71
8.7
1549
1096
Mycoplasmopsis
genus
0.005
0.72
8
1709
1230
More or Less often based on Reference Median High Incidence
Above we see that many of the top bacteria identified are sparse, that is not reported often. We then restrict them to those that occur above 50% or the time.
tax_name
Rank
Reference Median Freq
Odds Ratio
Chi2
Below
Above
Psychrobacter glacialis
species
0.002
0.37
150
636
238
Niabella aurantiaca
species
0.002
0.34
148.2
524
176
Desulfotomaculum
genus
0.004
0.51
147.5
1394
711
Alcanivorax
genus
0.002
0.26
145.8
375
98
Isoalcanivorax
genus
0.002
0.26
142.8
365
95
Isoalcanivorax indicus
species
0.002
0.26
142.8
365
95
Niabella
genus
0.002
0.38
132.4
560
212
Salidesulfovibrio
genus
0.002
0.3
127.5
381
115
Salidesulfovibrio brasiliensis
species
0.002
0.3
127.5
381
115
Bacteroides cellulosilyticus
species
0.237
0.59
127.2
2243
1325
Actinopolyspora
genus
0.002
0.38
125.5
524
198
Bifidobacterium
genus
0.048
1.68
125.3
1392
2332
Nostoc flagelliforme
species
0.002
0.27
122.8
316
84
Geobacillus
genus
0.003
0.43
122.4
672
291
Bacteroides heparinolyticus
species
0.003
0.49
122.1
928
454
Erysipelothrix muris
species
0.014
0.59
121.6
2029
1195
Pelagicoccus croceus
species
0.002
0.32
120.7
380
120
Deferribacter autotrophicus
species
0.002
0.31
120.3
374
117
Deferribacter
genus
0.002
0.32
119.9
377
119
Psychroflexus
genus
0.002
0.3
117.5
348
105
Summary
A large number of bacterial taxa exhibit shifts with P < 0.01 in association with this condition. The subsequent challenge is determining how to modulate these taxa, since the volume of candidates exceeds what most individuals can practically consider. Moreover, for many of the taxa identified, there is no published evidence in the U.S. National Library of Medicine describing how to alter their abundance.
A deep optimization model, such as the one implemented on the Microbiome Taxa R2 site, can be used to inform probiotic selection. This model provides coverage for each identified taxon and infers which probiotics are most likely to shift their levels. Its output may then be integrated with more conventional recommendations derived from literature indexed in the U.S. National Library of Medicine where such evidence exists, with the two recommendation sets reconciled by giving priority to probiotic-based suggestions.
Development of a dedicated database based on Biomesight samples is in progress. The current model uses data contributed by PrecisionBiome, and datasets generated with differing laboratory processing pipelines cannot be safely combined, as discussed in The taxonomy nightmare before Christmas…. Once the Biomesight-specific database is complete, an option for generating (offline-only) personalized suggestions will be added to the Microbiome Prescription website.
Probiotics Suggestions
The following are based on a simplified algorithm using R2 data for Biomesight. These are tentative numbers subject to future refinements. Bacteria listed are only for probiotics detected with Biomesight tests. Probiotics include some that are available only in some countries and some that are pending approval for retail sale.
Good Count: Number of bacteria expected to shift in desired direction
Bad Count: Number of bacteria expected to shift in wrong direction
Impact: Estimator of impact based on Chi-2, Slope and R2 vectors
This document presents the results of statistical analysis on symptoms from viable, self-annotated Biomesight microbiome samples. The methodology for data acquisition is outlined in New Standards for Microbiome Analysis?.
Tables have been refined to display only genus- and species-level taxa, the 20 most prominent entries per group, and associations achieving statistical significance (P < 0.01).
The following sections provide the processed data, accompanied by guidance on interpretation and application. Counts of significant bacterial taxa are included, reflecting the application of non-standard but rigorously validated statistical approaches to extensive sample and reference populations, where statistical power derives from dataset scale.
Significance
Genus
p < 0.01
202
p < 0.001
173
p < 0.0001
145
p < 0.00001
129
Averages and Medians
I prefer medians over averages. Medians are the values where half of the people have less and half has more. If the data was a bell-curve, then the values will almost be the same… with bacteria that happens rarely. Look at Bacteroides uniformis below, we see that the average is above and the median below.
If symptom median is higher than reference median, it means there is more of this bacteria. If lower, then less. This ignores how often the bacteria is seen (we average only over reports).
tax_name
Rank
Symptom Avarage
Reference Average
Symptom Median
Reference Median
Bacteroides
genus
27.633
25.884
24.121
26.729
Bacteroides uniformis
species
2.985
2.705
1.527
2.059
Novispirillum
genus
0.784
0.876
0.085
0.174
Insolitispirillum
genus
0.784
0.877
0.086
0.174
Insolitispirillum peregrinum
species
0.784
0.877
0.086
0.174
Bacteroides cellulosilyticus
species
1.024
0.836
0.073
0.151
Bilophila
genus
0.376
0.348
0.206
0.265
Bifidobacterium
genus
0.607
0.969
0.131
0.072
Bilophila wadsworthia
species
0.365
0.339
0.196
0.255
Blautia obeum
species
0.654
0.563
0.228
0.281
Hathewaya histolytica
species
0.318
0.275
0.154
0.188
Hathewaya
genus
0.318
0.275
0.154
0.188
Lachnobacterium
genus
0.327
0.32
0.075
0.049
Anaerotruncus
genus
0.213
0.184
0.136
0.159
Bifidobacterium longum
species
0.248
0.33
0.05
0.029
Oribacterium
genus
0.123
0.131
0.074
0.053
Anaerotruncus colihominis
species
0.2
0.173
0.133
0.153
Oribacterium sinus
species
0.116
0.127
0.072
0.053
Odoribacter
genus
0.194
0.197
0.123
0.139
Megamonas
genus
0.42
0.439
0.003
0.018
Bacteria Incidence – How often is it reported
The common sense belief is that if a bacteria is reported more often, then the amount should be higher. This is often not true. The microbiome is a complex thing. Look at Bacteroides uniformis below, we see that the average is above and the median below
tax_name
Rank
Incidence Odds Ratio
Chi2
Symptoms %
Reference %
Prevotella bivia
species
1.42
9.5
26.9
19
More or Less often based on Symptom Median All Incidence
This is a little more complex to understand. If we compute the mid point for people with the symptom, then if the bacteria was not involved then half of the reference should be above this value and half below this value. If not, it means that the symptom tends to over or under growth.
tax_name
Rank
Symptom Median
Odds Ratio
Chi2
Below
Above
Alcanivorax
genus
0.002
0.27
77.8
360
99
Isoalcanivorax
genus
0.002
0.27
77.3
349
95
Isoalcanivorax indicus
species
0.002
0.27
77.3
349
95
Niabella aurantiaca
species
0.002
0.34
69.1
505
172
Psychroflexus
genus
0.002
0.3
66.9
345
105
Psychroflexus gondwanensis
species
0.002
0.3
66.9
345
105
Salidesulfovibrio
genus
0.002
0.32
65.7
376
120
Salidesulfovibrio brasiliensis
species
0.002
0.32
65.7
376
120
Deferribacter autotrophicus
species
0.002
0.32
65.4
366
116
Deferribacter
genus
0.002
0.32
64.5
368
118
Psychrobacter glacialis
species
0.002
0.38
62.5
623
237
Pelagicoccus croceus
species
0.002
0.32
62.3
357
116
Rickettsia marmionii Stenos et al. 2005
species
0.002
0.34
60.6
372
125
Bacillus ferrariarum
species
0.002
0.34
58.4
350
118
Niabella
genus
0.002
0.39
56.6
542
211
Actinopolyspora
genus
0.002
0.39
55.8
505
195
Chromatium
genus
0.002
0.39
54.7
480
185
Chromatium weissei
species
0.002
0.39
54.4
479
185
Viridibacillus neidei
species
0.002
0.38
53.7
445
170
Segetibacter aerophilus
species
0.002
0.36
53.7
353
126
More or Less often based on Reference Median All Incidence
This is like the above, but with a different line in the sand. Instead of the median of those with the condition, we use the median of the reference set.
tax_name
Rank
Reference Median
Odds Ratio
Chi2
Below
Above
Methylobacillus glycogenes
species
0.003
0.4
217.9
1190
477
Methylobacillus
genus
0.003
0.42
203.2
1190
496
Psychrobacter glacialis
species
0.002
0.38
143.2
623
237
Niabella aurantiaca
species
0.002
0.34
140.5
505
172
Alcanivorax
genus
0.002
0.27
133.4
360
99
Isoalcanivorax
genus
0.002
0.27
131
349
95
Isoalcanivorax indicus
species
0.002
0.27
131
349
95
Niabella
genus
0.002
0.39
122.8
542
211
Salidesulfovibrio
genus
0.002
0.32
117.8
376
120
Salidesulfovibrio brasiliensis
species
0.002
0.32
117.8
376
120
Actinopolyspora
genus
0.002
0.39
117.1
505
195
Deferribacter autotrophicus
species
0.002
0.32
115.9
366
116
Psychroflexus
genus
0.002
0.3
115.2
345
105
Psychroflexus gondwanensis
species
0.002
0.3
115.2
345
105
Deferribacter
genus
0.002
0.32
114.9
368
118
Chromatium
genus
0.002
0.39
112.4
480
185
Chromatium weissei
species
0.002
0.39
111.9
479
185
Helicobacter suncus
species
0.002
0.46
111.6
717
333
Pelagicoccus croceus
species
0.002
0.32
110
357
116
Rickettsia marmionii Stenos et al. 2005
species
0.002
0.34
109.4
372
125
More or Less often based on Symptom Median High Incidence
Above we see that many of the top bacteria identified are sparse, that is not reported often. We then restrict them to those that occur above 50% or the time.
tax_name
Rank
Symptom Median Freq
Odds Ratio
Chi2
Below
Above
Clostridium taeniosporum
species
0.003
0.61
21
1269
777
Dethiosulfovibrio
genus
0.004
0.67
14.6
1417
946
Tetragenococcus doogicus
species
0.003
0.68
12.6
1279
876
Hydrocarboniphaga daqingensis
species
0.004
0.72
9.8
1499
1078
Mycoplasmopsis
genus
0.005
0.72
9.7
1661
1199
Pediococcus
genus
0.004
0.75
7.2
1217
913
Propionispora hippei
species
0.005
0.76
6.8
1449
1101
Propionispora
genus
0.005
0.76
6.7
1448
1102
More or Less often based on Reference Median High Incidence
Above we see that many of the top bacteria identified are sparse, that is not reported often. We then restrict them to those that occur above 50% or the time.
Methylobacillus glycogenes
species
0.003
0.4
217.9
1190
477
Methylobacillus
genus
0.003
0.42
203.2
1190
496
Psychrobacter glacialis
species
0.002
0.38
143.2
623
237
Niabella aurantiaca
species
0.002
0.34
140.5
505
172
Alcanivorax
genus
0.002
0.27
133.4
360
99
Isoalcanivorax
genus
0.002
0.27
131
349
95
Isoalcanivorax indicus
species
0.002
0.27
131
349
95
Niabella
genus
0.002
0.39
122.8
542
211
Salidesulfovibrio
genus
0.002
0.32
117.8
376
120
Salidesulfovibrio brasiliensis
species
0.002
0.32
117.8
376
120
Actinopolyspora
genus
0.002
0.39
117.1
505
195
Deferribacter autotrophicus
species
0.002
0.32
115.9
366
116
Psychroflexus
genus
0.002
0.3
115.2
345
105
Psychroflexus gondwanensis
species
0.002
0.3
115.2
345
105
Deferribacter
genus
0.002
0.32
114.9
368
118
Chromatium
genus
0.002
0.39
112.4
480
185
Chromatium weissei
species
0.002
0.39
111.9
479
185
Helicobacter suncus
species
0.002
0.46
111.6
717
333
Pelagicoccus croceus
species
0.002
0.32
110
357
116
Rickettsia marmionii Stenos et al. 2005
species
0.002
0.34
109.4
372
125
Summary
A large number of bacterial taxa exhibit shifts with P < 0.01 in association with this condition. The subsequent challenge is determining how to modulate these taxa, since the volume of candidates exceeds what most individuals can practically consider. Moreover, for many of the taxa identified, there is no published evidence in the U.S. National Library of Medicine describing how to alter their abundance.
A deep optimization model, such as the one implemented on the Microbiome Taxa R2 site, can be used to inform probiotic selection. This model provides coverage for each identified taxon and infers which probiotics are most likely to shift their levels. Its output may then be integrated with more conventional recommendations derived from literature indexed in the U.S. National Library of Medicine where such evidence exists, with the two recommendation sets reconciled by giving priority to probiotic-based suggestions.
Development of a dedicated database based on Biomesight samples is in progress. The current model uses data contributed by PrecisionBiome, and datasets generated with differing laboratory processing pipelines cannot be safely combined, as discussed in The taxonomy nightmare before Christmas…. Once the Biomesight-specific database is complete, an option for generating (offline-only) personalized suggestions will be added to the Microbiome Prescription website.
Probiotics Suggestions
The following are based on a simplified algorithm using R2 data for Biomesight. These are tentative numbers subject to future refinements. Bacteria listed are only for probiotics detected with Biomesight tests. Probiotics include some that are available only in some countries and some that are pending approval for retail sale.
Good Count: Number of bacteria expected to shift in desired direction
Bad Count: Number of bacteria expected to shift in wrong direction
Impact: Estimator of impact based on Chi-2, Slope and R2 vectors
This document presents the results of statistical analysis on symptoms from viable, self-annotated Biomesight microbiome samples. The methodology for data acquisition is outlined in New Standards for Microbiome Analysis?.
Tables have been refined to display only genus- and species-level taxa, the 20 most prominent entries per group, and associations achieving statistical significance (P < 0.01).
The following sections provide the processed data, accompanied by guidance on interpretation and application. Counts of significant bacterial taxa are included, reflecting the application of non-standard but rigorously validated statistical approaches to extensive sample and reference populations, where statistical power derives from dataset scale.
Significance
Genus
p < 0.01
182
p < 0.001
164
p < 0.0001
146
p < 0.00001
130
Averages and Medians
I prefer medians over averages. Medians are the values where half of the people have less and half has more. If the data was a bell-curve, then the values will almost be the same… with bacteria that happens rarely. Look at the bacterua below, we see that for some the average is above and the median below. Should one increase or decrease this bacteria?
If symptom median is higher than reference median, it means there is more of this bacteria. If lower, then less. This ignores how often the bacteria is seen (we average only over reports). IMHO using average value instead of median will often result in a worse situation for the patient
tax_name
Rank
Symptom Avarage
Reference Average
Symptom Median
Reference Median
Bacteroides
genus
31.102
25.834
24.217
30.409
Faecalibacterium
genus
10.531
12.875
12.155
9.178
Faecalibacterium prausnitzii
species
10.193
12.301
11.47
8.958
Phocaeicola vulgatus
species
6.283
5.788
3.427
4.247
Bacteroides uniformis
species
3.229
2.71
1.559
2.11
Ruminococcus
genus
5.96
5.586
4.394
3.874
Coprococcus
genus
1.313
1.436
0.738
0.483
Clostridium
genus
2.067
1.85
1.359
1.612
Phocaeicola dorei
species
3.715
2.873
0.412
0.196
Bacteroides thetaiotaomicron
species
1.612
1.049
0.463
0.593
Bacteroides cellulosilyticus
species
1.092
0.844
0.075
0.179
Lachnospira pectinoschiza
species
0.549
0.668
0.337
0.245
Ruminococcus bromii
species
0.784
0.791
0.174
0.083
Bifidobacterium
genus
0.574
0.95
0.128
0.045
Bilophila wadsworthia
species
0.387
0.34
0.199
0.273
Bilophila
genus
0.395
0.348
0.209
0.281
Lachnobacterium
genus
0.222
0.325
0.076
0.028
Sutterella wadsworthensis
species
0.711
0.657
0.059
0.011
Dorea
genus
0.494
0.482
0.292
0.336
Hathewaya
genus
0.381
0.275
0.155
0.198
Bacteria Incidence – How often is it reported
The common sense belief is that if a bacteria is reported more often, then the amount should be higher. This is often not true. The microbiome is a complex thing.
tax_name
Rank
Incidence Odds Ratio
Chi2
Symptoms %
Reference %
Halanaerobium
genus
1.58
7.7
26.4
16.7
More or Less often based on Symptom Median All Incidence
This is a little more complex to understand. If we compute the mid point for people with the symptom, then if the bacteria was not involved then half of the reference should be above this value and half below this value. If not, it means that the symptom tends to over or under growth.
tax_name
Rank
Symptom Median
Odds Ratio
Chi2
Below
Above
Isoalcanivorax
genus
0.002
0.26
53.9
371
98
Isoalcanivorax indicus
species
0.002
0.26
53.9
371
98
Alcanivorax
genus
0.002
0.27
53.8
382
102
Niabella aurantiaca
species
0.002
0.33
43.2
545
182
Pelagicoccus croceus
species
0.002
0.32
40.7
378
122
Psychrobacter glacialis
species
0.002
0.38
35.8
660
250
Niabella
genus
0.002
0.38
35
585
221
Viridibacillus neidei
species
0.002
0.38
32.9
472
179
Chromatium
genus
0.002
0.39
32.1
515
200
Chromatium weissei
species
0.002
0.39
32
514
200
Sporosarcina pasteurii
species
0.002
0.4
28.6
444
179
Thiorhodococcus
genus
0.002
0.42
27.4
578
245
Syntrophomonas sapovorans
species
0.002
0.42
27
536
227
Sporosarcina
genus
0.002
0.42
26.9
448
186
Lysinibacillus
genus
0.002
0.42
25.9
401
167
Thermodesulfovibrio thiophilus
species
0.002
0.45
23.5
540
243
Oenococcus
genus
0.002
0.46
22.6
601
277
Thermodesulfovibrio
genus
0.002
0.47
22.1
625
292
Helicobacter suncus
species
0.002
0.48
21.7
761
363
Viridibacillus
genus
0.002
0.5
17.6
486
242
More or Less often based on Reference Median All Incidence
This is like the above, but with a different line in the sand. Instead of the median of those with the condition, we use the median of the reference set.
tax_name
Rank
Reference Median
Odds Ratio
Chi2
Below
Above
Lachnobacterium
genus
0.028
2.07
243
1197
2474
Bifidobacterium longum
species
0.0135
2.14
228.2
900
1929
Paenibacillus
genus
0.003
0.38
208.1
999
384
Erysipelothrix
genus
0.017
0.51
205.7
2244
1135
Anaerobranca zavarzinii
species
0.005
1.98
195.5
1046
2066
Anaerobranca
genus
0.005
1.98
195.5
1046
2066
Erysipelothrix muris
species
0.016
0.52
191.4
2194
1135
Slackia
genus
0.009
1.9
182.1
1161
2202
Legionella shakespearei
species
0.003
0.37
158.9
659
243
Bacteroides
genus
30.409
0.57
158.2
2511
1422
Faecalibacterium
genus
9.178
1.76
157.2
1423
2508
Niabella aurantiaca
species
0.002
0.33
155.3
545
182
Eubacterium callanderi
species
0.007
0.54
155.2
1882
1016
Holdemania
genus
0.027
0.56
153.4
2222
1244
Psychrobacter glacialis
species
0.002
0.38
152.7
660
250
Bifidobacterium
genus
0.045
1.73
146.5
1413
2447
Methylonatrum
genus
0.004
0.54
142.5
1617
870
Methylonatrum kenyense
species
0.004
0.54
142.5
1617
870
Amedibacillus dolichus
species
0.022
0.54
141.7
1678
912
Amedibacillus
genus
0.022
0.54
141.4
1677
912
More or Less often based on Symptom Median High Incidence
Above we see that many of the top bacteria identified are sparse, that is not reported often. We then restrict them to those that occur above 50% or the time.
tax_name
Rank
Symptom Median Freq
Odds Ratio
Chi2
Below
Above
Clostridium taeniosporum
species
0.003
0.61
10.2
1349
827
Dethiosulfovibrio
genus
0.004
0.67
6.7
1505
1012
More or Less often based on Reference Median High Incidence
Above we see that many of the top bacteria identified are sparse, that is not reported often. We then restrict them to those that occur above 50% or the time.
tax_name
Rank
Reference Median Freq
Odds Ratio
Chi2
Below
Above
Lachnobacterium
genus
0.028
2.07
243
1197
2474
Bifidobacterium longum
species
0.0135
2.14
228.2
900
1929
Paenibacillus
genus
0.003
0.38
208.1
999
384
Erysipelothrix
genus
0.017
0.51
205.7
2244
1135
Anaerobranca zavarzinii
species
0.005
1.98
195.5
1046
2066
Anaerobranca
genus
0.005
1.98
195.5
1046
2066
Erysipelothrix muris
species
0.016
0.52
191.4
2194
1135
Slackia
genus
0.009
1.9
182.1
1161
2202
Legionella shakespearei
species
0.003
0.37
158.9
659
243
Bacteroides
genus
30.409
0.57
158.2
2511
1422
Faecalibacterium
genus
9.178
1.76
157.2
1423
2508
Niabella aurantiaca
species
0.002
0.33
155.3
545
182
Eubacterium callanderi
species
0.007
0.54
155.2
1882
1016
Holdemania
genus
0.027
0.56
153.4
2222
1244
Psychrobacter glacialis
species
0.002
0.38
152.7
660
250
Bifidobacterium
genus
0.045
1.73
146.5
1413
2447
Methylonatrum
genus
0.004
0.54
142.5
1617
870
Methylonatrum kenyense
species
0.004
0.54
142.5
1617
870
Amedibacillus dolichus
species
0.022
0.54
141.7
1678
912
Amedibacillus
genus
0.022
0.54
141.4
1677
912
Summary
A large number of bacterial taxa exhibit shifts with P < 0.01 in association with this condition. The subsequent challenge is determining how to modulate these taxa, since the volume of candidates exceeds what most individuals can practically consider. Moreover, for many of the taxa identified, there is no published evidence in the U.S. National Library of Medicine describing how to alter their abundance.
A deep optimization model, such as the one implemented on the Microbiome Taxa R2 site, can be used to inform probiotic selection. This model provides coverage for each identified taxon and infers which probiotics are most likely to shift their levels. Its output may then be integrated with more conventional recommendations derived from literature indexed in the U.S. National Library of Medicine where such evidence exists, with the two recommendation sets reconciled by giving priority to probiotic-based suggestions.
Development of a dedicated database based on Biomesight samples is in progress. The current model uses data contributed by PrecisionBiome, and datasets generated with differing laboratory processing pipelines cannot be safely combined, as discussed in The taxonomy nightmare before Christmas…. Once the Biomesight-specific database is complete, an option for generating (offline-only) personalized suggestions will be added to the Microbiome Prescription website.
Probiotics Suggestions
The following are based on a simplified algorithm using R2 data for Biomesight. These are tentative numbers subject to future refinements. Bacteria listed are only for probiotics detected with Biomesight tests. Probiotics include some that are available only in some countries and some that are pending approval for retail sale.
Good Count: Number of bacteria expected to shift in desired direction
Bad Count: Number of bacteria expected to shift in wrong direction
Impact: Estimator of impact based on Chi-2, Slope and R2 vectors
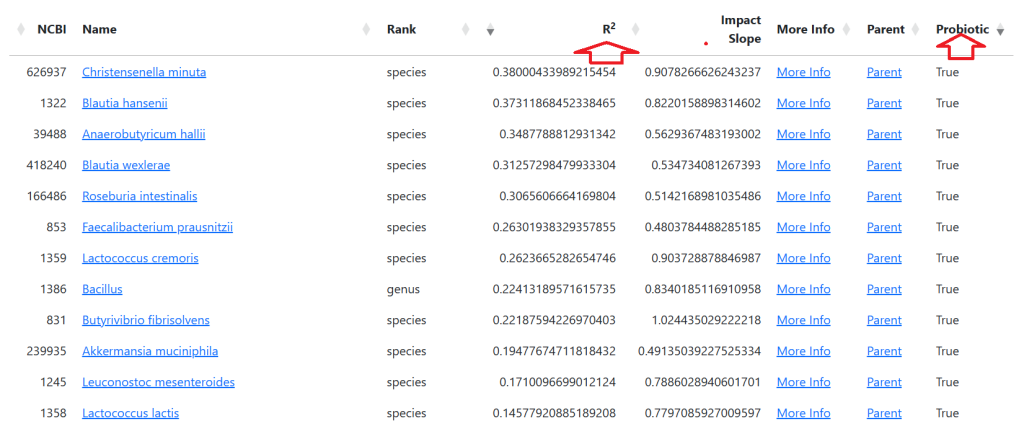
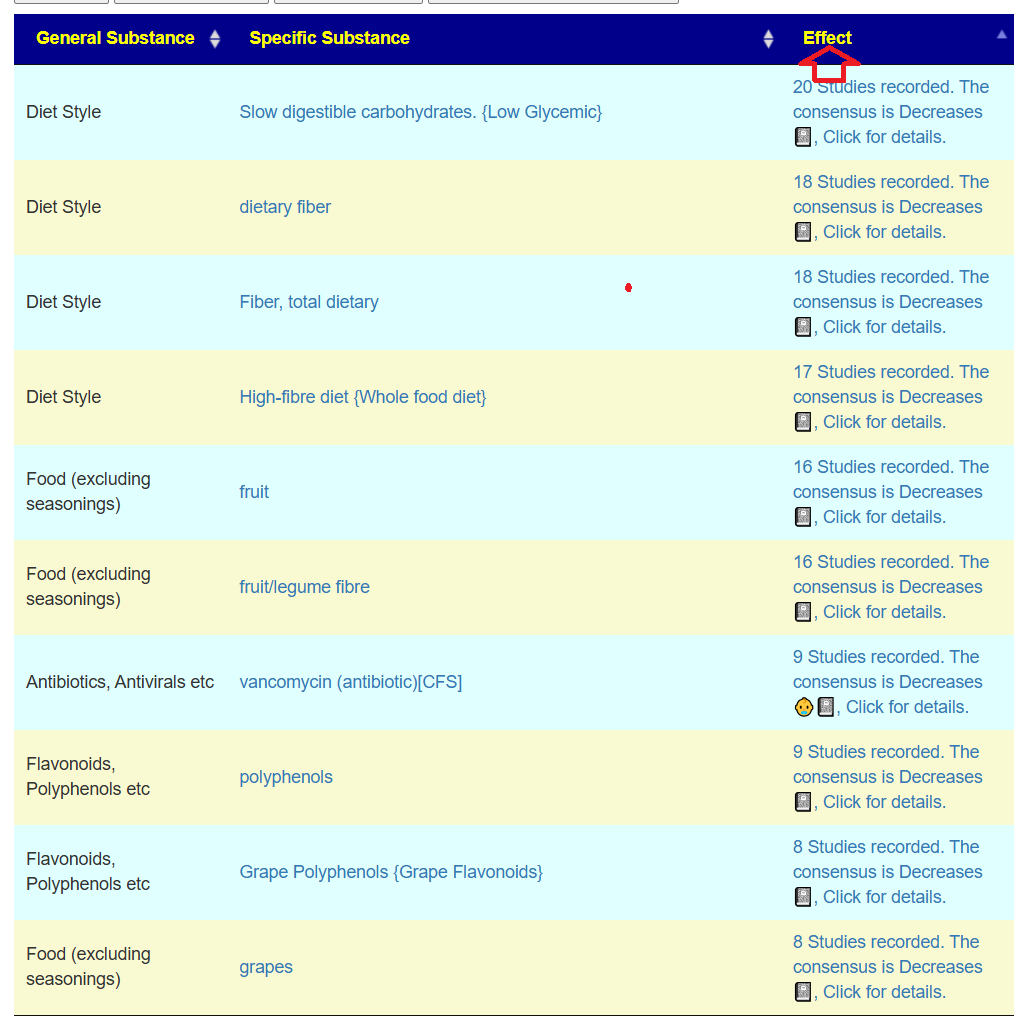
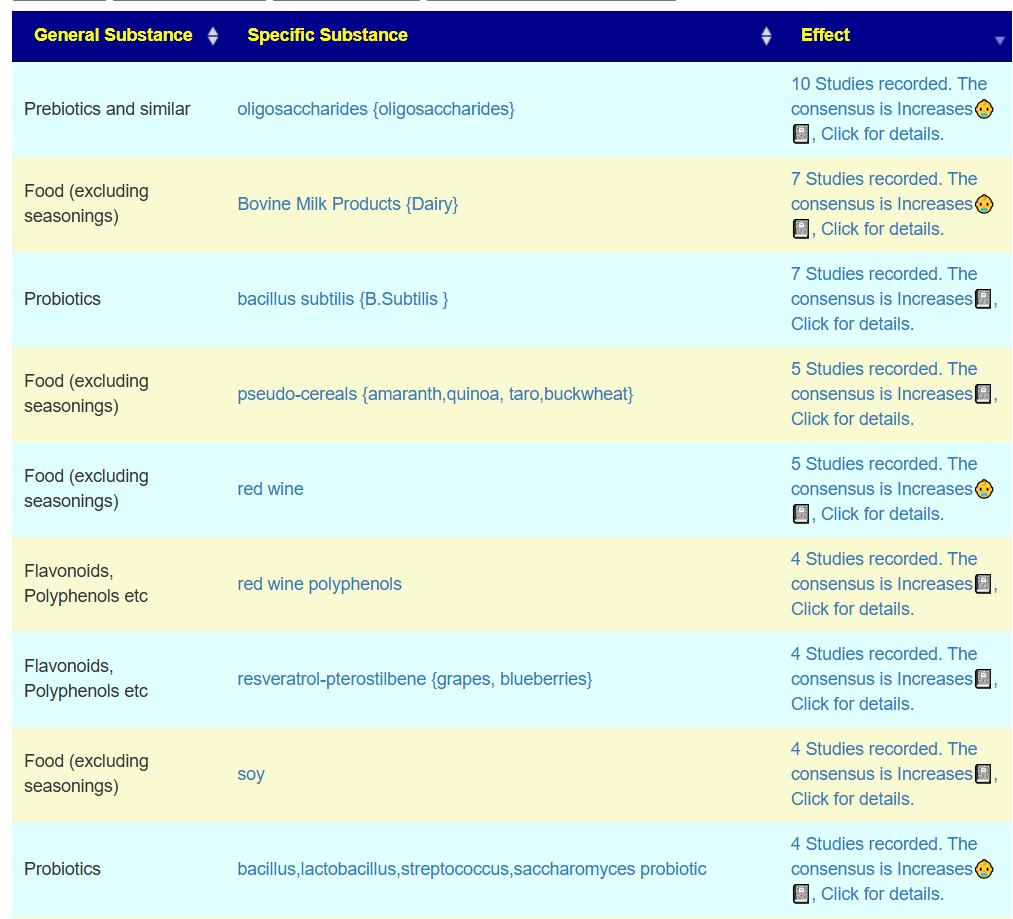
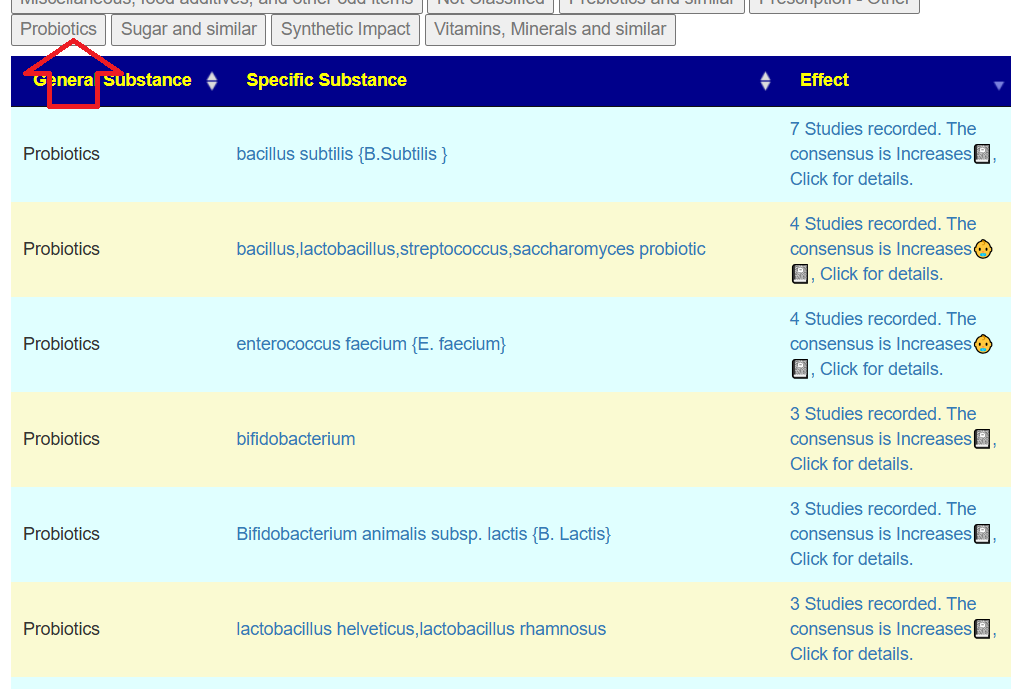

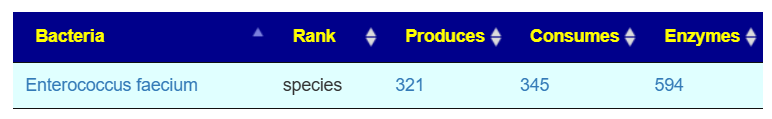
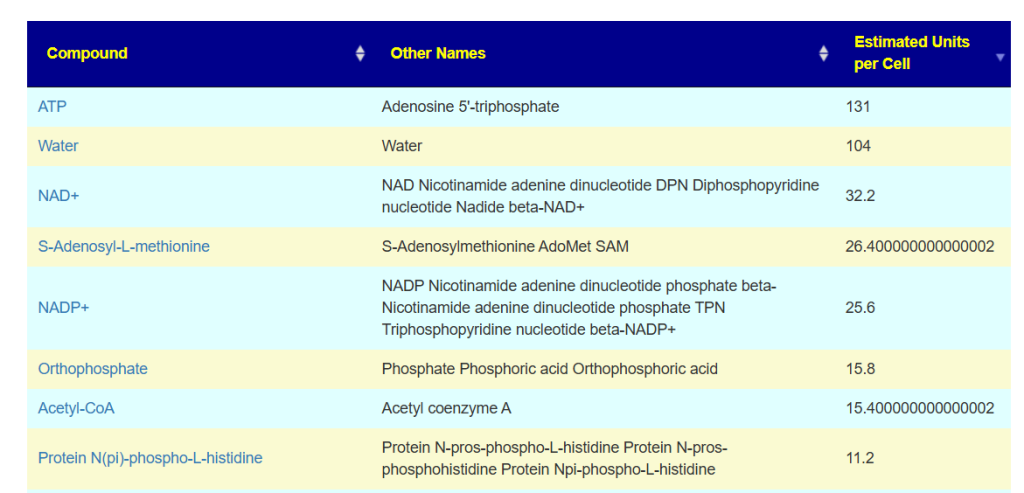

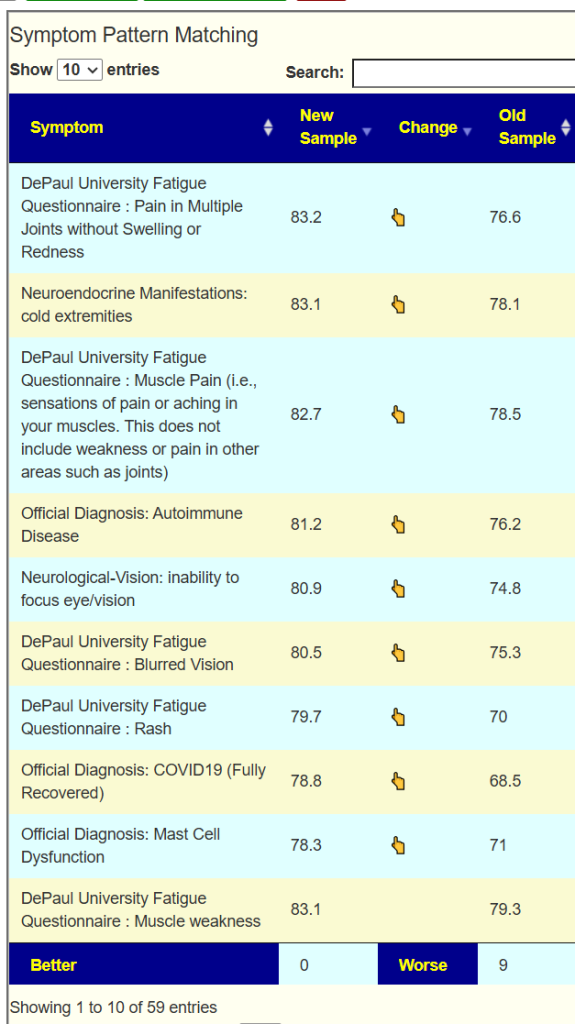
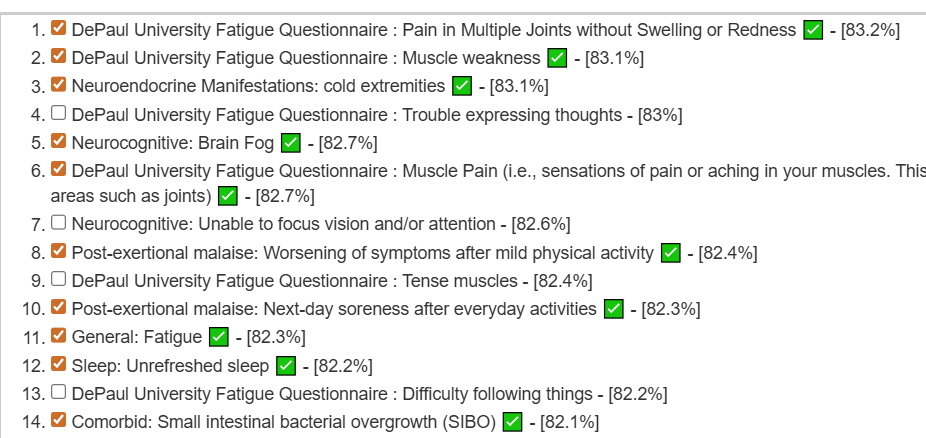
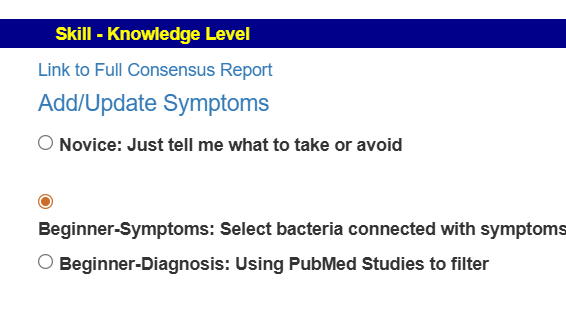
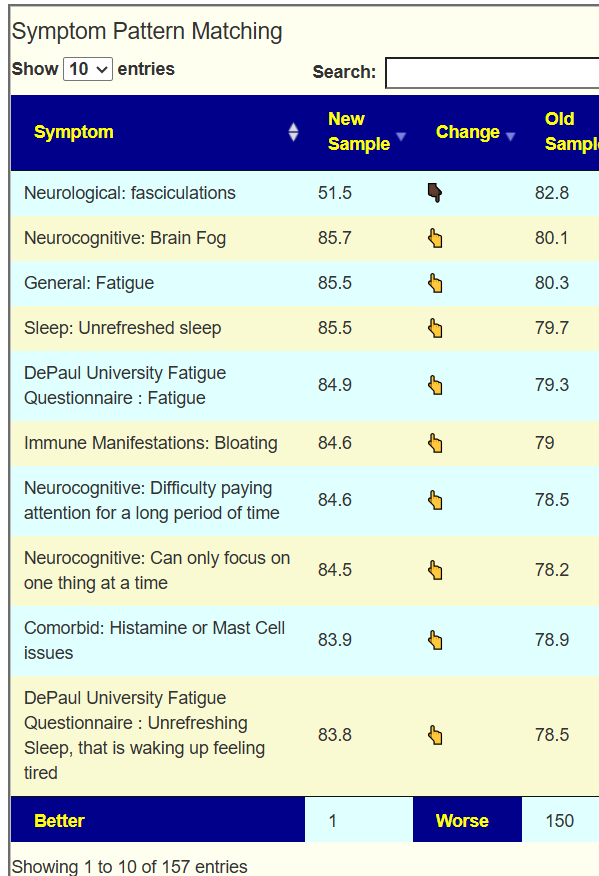


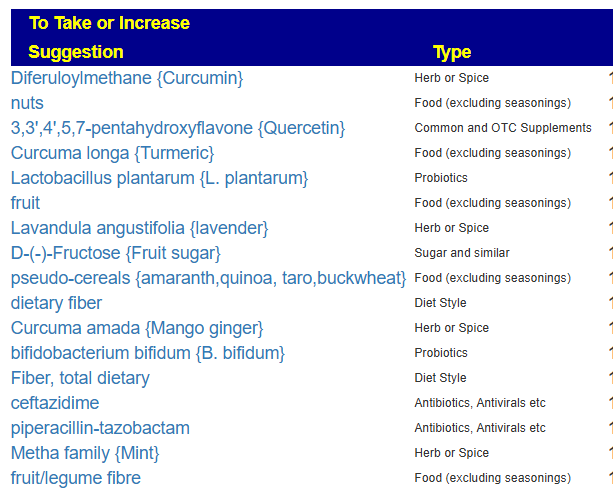
Recent Comments