The calculations were audited and several errors found and corrected.

Significant changes
Charts against samples from the same lab are shown by clicking on the chart icon.
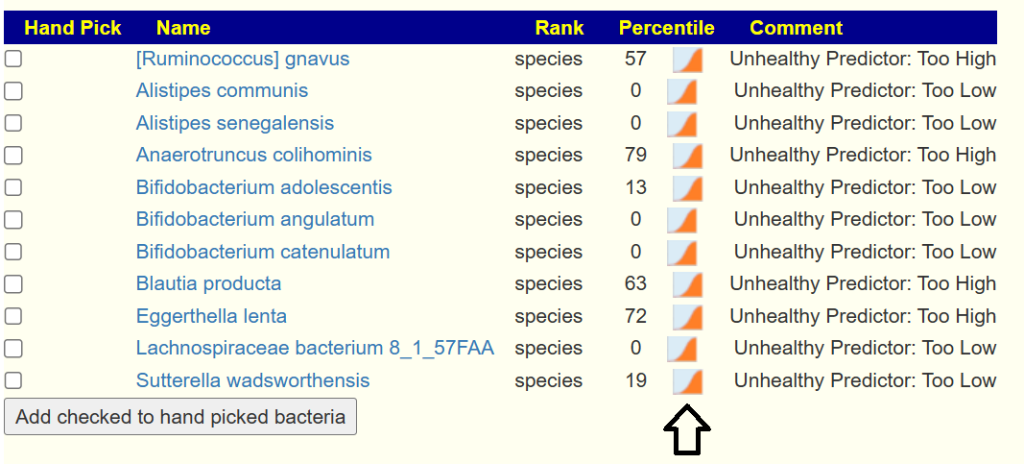
For example:
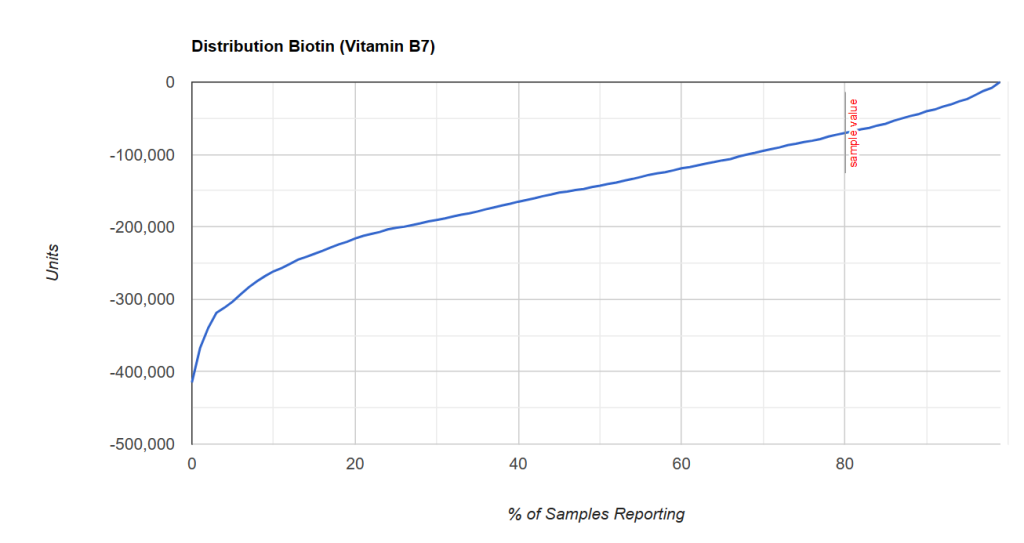
NOTE: negative numbers means bacteria are consuming, thus less consumption means more gets to the body. We calculate both producers and consumers.
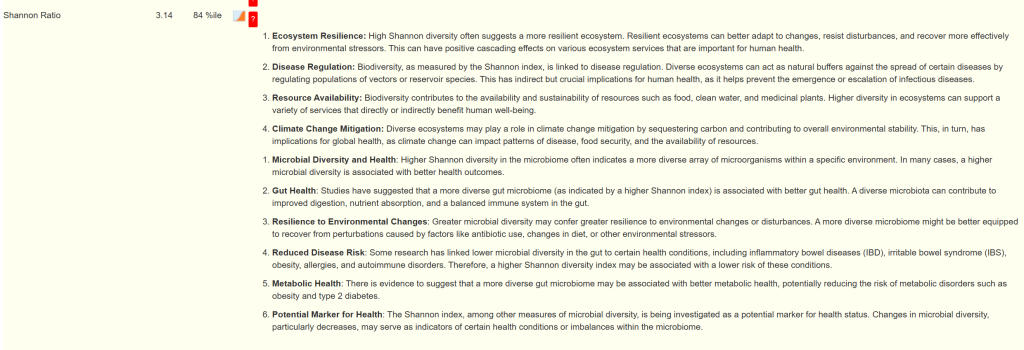
Information on what something means
There is a red question mark that will show more information about the measure

A walkthrough video is below.
Walkthru of new and revised features on the Health Indicators Page (youtube.com)
Recent Comments