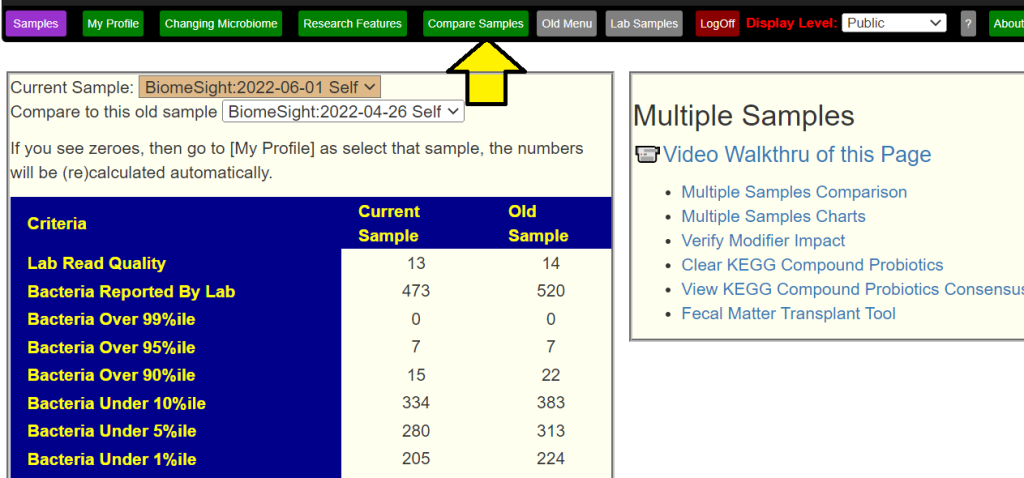
A reader asked me to compared her latest sample to her prior samples. Comparing samples can be time consuming and complex, so I revisited my past comparisons posts and created a table that saves time and add clarity.

Bacteria Report
- Lab Read Quality indicates the numbers of bacteria that the lab obtained. In this case, the quality of the samples were similar
- This impacts Bacteria Reported. In this case 1/14 less, and the bacteria count is about 1/14 less. If there was a severe change, then we wish to understand why
- Bacteria Over/Under: Between samples we would like them to be reduced (less extremes). If lab quality goes down or up a lot, then the numbers may need to be adjusted for comparison.
- We see more than a 1/14 drop, which indicates a better microbiome.

Lab Relatives
If both labs were done with the same provider, then this section will appear. In this case we see that rarely seen bacteria goes down – a good sign.

Foreign Criteria
This applies various foreign criteria to the samples. The increase of pathogen is a potential concern. I tend not to focus on pathogens because the source data usually report “higher” or “lower” only.

Microbiome Prescription Criteria
This reports on the main approaches used for generating consensus suggestions. All of them indicate little change except KM which suggests improvement.

PubMed Conditions
This uses the literature from the US National Library of Medicine to estimate likelihood of having various conditions. It is a fuzzy estimate due to the what the studies report. In this case we see good improvement across the board.

KEGG Criteria
As above, we want to reduce extreme values (represented by high and low percentiles). What we see below is very significant improvement across the board.

Bottom Line
The above are the list of my first go-to items comparing samples. If someone has followed the suggestions from Dr.A.I. between samples (or done other things), it give a quantification of the changes that occur across multiple dimensions.
In this case, we see significant improvement over a few months! It should be noted that the various external criteria show no apparent changes, the deeper dive that Microbiome Prescription does show significant positive changes.
1 thought on “Comparing Samples – Update”
Comments are closed.