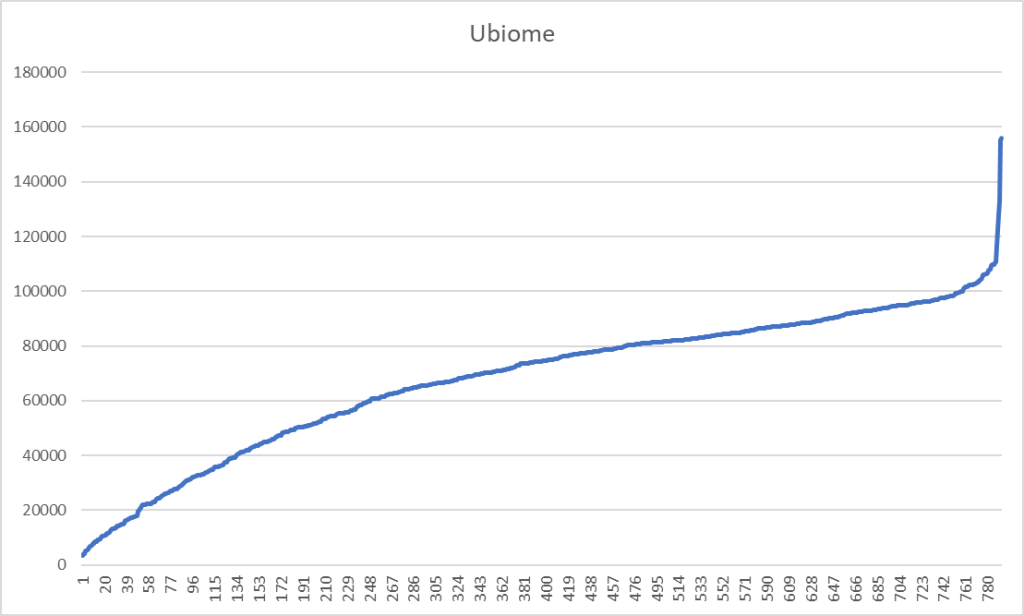
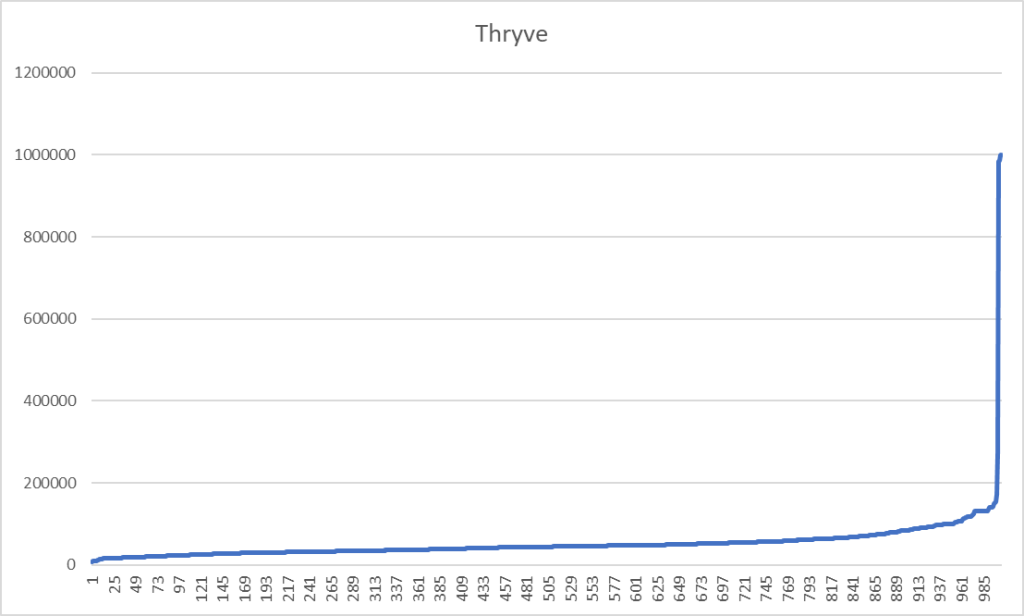
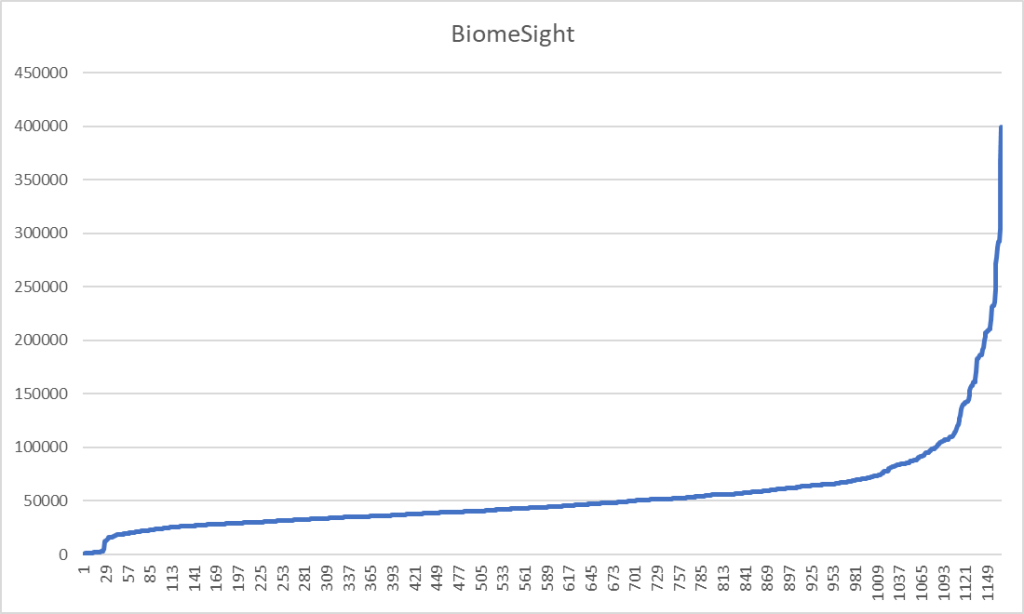
A reader on Facebook requested this data (since I am likely the only one that has the data that can speak of it). Here’s the charts – Have fun interpreting
A reader on Facebook requested this data (since I am likely the only one that has the data that can speak of it). Here’s the charts – Have fun interpreting
Recent Comments