My exploration of microbiome modification began with reading studies archived in the U.S. National Library of Medicine. As someone who has been developing expert systems since the 1990s, my instinct was to encode the findings from these studies as facts within an expert system—letting logic determine the optimal course of action.
In artificial intelligence (AI), an expert system is a computer system emulating the decision-making ability of a human expert. Expert systems are designed to solve complex problems by reasoning through bodies of knowledge, represented mainly as if–then rules rather than through conventional procedural programming code — Wikipedia
Some Difficult Discoveries
As I built the knowledge base, some major problems quickly emerged:
Results from different studies often contradicted one another.
Some results were replicated consistently, while others produced conflicting outcomes.
Certain findings were reported only once and never replicated.
There was significant uncertainty about bacterial identification due to non-standardized testing methods (see this explanation).
Studies tended to report results at a single taxonomy rank—often not the rank relevant to my analysis.
To address the first issue, I incorporated fuzzy logic into the expert system, allowing it to handle ambiguity and partial truths rather than rigid yes/no classifications.
Fuzzy logic is based on the observation that people make decisions based on imprecise and non-numerical information. Fuzzy models or fuzzy sets are mathematical means of representing vagueness and imprecise information (hence the term fuzzy). These models have the capability of recognising, representing, manipulating, interpreting, and using data and information that are vague and lack certainty. — Wikipedia
The second issue required a different approach. I began using bacterial association data (available here) to infer relationships between taxa. For example, if a compound influenced the genus Bifidobacterium, I could reasonably infer a similar effect for its species. This two-way relationship also works in reverse: if you want to increase Bifidobacterium overall, the species Bifidobacterium longum—a readily available probiotic—shows the strongest positive association.
Species Name
Estimate Percentage Inference
Bifidobacterium actinocoloniiforme
18.8
Bifidobacterium adolescentis
54.8
Bifidobacterium angulatum
26.6
Bifidobacterium animalis
14.5
Bifidobacterium asteroides
40.2
Bifidobacterium avesanii
34.2
Bifidobacterium bifidum
25.5
Bifidobacterium bohemicum
52.7
Bifidobacterium bombi
57.7
Bifidobacterium boum
64.1
Bifidobacterium breve
52.4
Bifidobacterium catenulatum
33.9
Bifidobacterium choerinum
66.6
Bifidobacterium commune
45.4
Bifidobacterium cuniculi
21.8
Bifidobacterium dentium
23.2
Bifidobacterium gallicum
30.8
Bifidobacterium indicum
52.9
Bifidobacterium lemurum
50.4
Bifidobacterium longum
73.7
Bifidobacterium magnum
62.5
Bifidobacterium minimum
27.5
Bifidobacterium mongoliense
31.9
Bifidobacterium pseudocatenulatum
31.2
Bifidobacterium pullorum
30.2
Bifidobacterium ruminantium
20.4
Bifidobacterium scardovii
16.9
Bifidobacterium subtile
38.8
Bifidobacterium thermacidophilum
44.5
Bifidobacterium thermophilum
29.8
Bifidobacterium tsurumiense
11.7
With fuzzy logic, study findings indicating increases or decreases could be translated into numerical values. Using bacterial association data, I could then adjust those values to create a more accurate estimate of impact.
Why Do the Mathematics?
Modern AI models, particularly Large Language Models (LLMs), operate differently. They generate responses by finding text that resembles the question rather than reasoning from factual relationships. LLMs do not distinguish whether data comes from a single study or many, nor do they analyze hierarchical relationships within bacterial taxonomy. As a result, taxonomic nuances—such as the difference between Lactobacillus reuteri and Limosilactobacillus reuteri—are often overlooked because the evolution of bacterial naming conventions is ignored.
At the other end of the treatment spectrum is a “whole health” influencer who might recall a single study about Bifidobacterium dentium and use it to infer a complete treatment plan. My approach is simpler: I prefer actions grounded in probability—ones that have the best odds of success.
This is a bit of the engine used on my free site for individuals, Microbiome Prescription. At present we have 14,388,582 million facts over 1,882 modifiers.
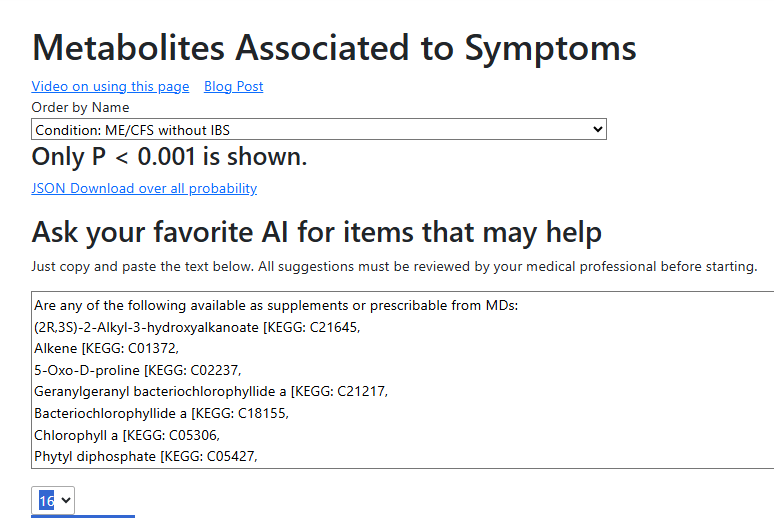
Recently on my Microbiome Sites I added a table of metabolites whose presence or absence is associated with various symptoms. Technical details is give in this post: Metabolites and Symptoms. The volume of data is overwhelming.
Today I realized that a good solution is to have the page frame a question that people can paste into their favorite AI.
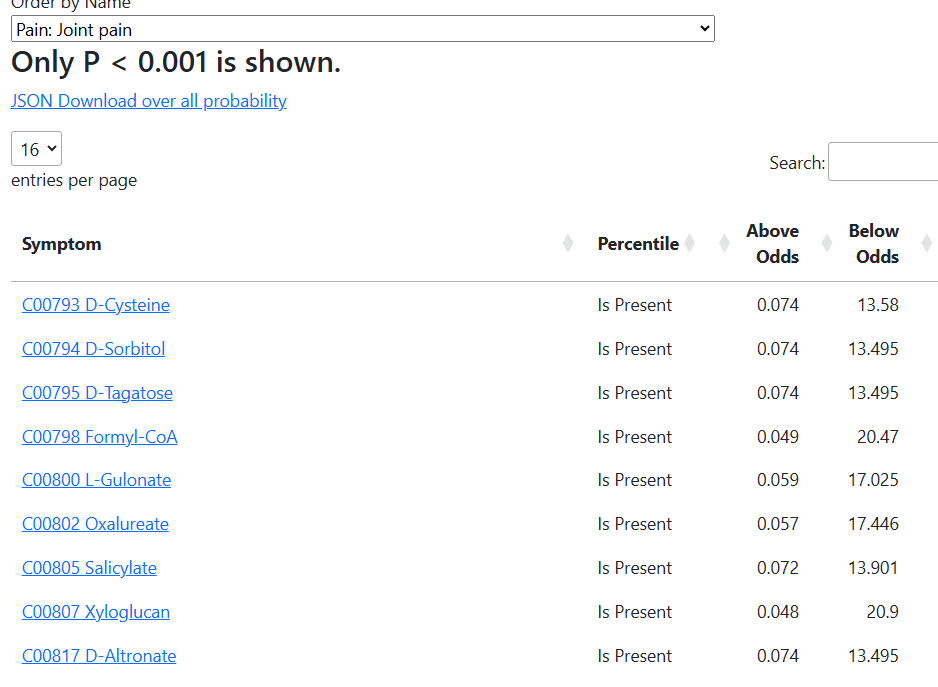
These metabolites have been identified statistically: their levels, estimated from the microbiome, are abnormally low with P < 0.001 for people reporting this symptom pattern (for example, ME/CFS without IBS). They are hypothesis-generating signals only and have not been validated in clinical trials. In my opinion, they highlight candidates that could be explored in formal clinical research or cautiously by an experienced physician with individual patients. None of these AI-assisted suggestions should be used without review and approval by an appropriate medical professional.
For example ME/CFS without IBS link as an example or to look at other symptoms go to that page and change the drop down. In terms of PROBIOTIC TRIALS, you want to see which of these substances are produced by bacteria.
Instead of “Are any of the following available as supplements or prescriptible from MDs:” ask, “Are any of the following available produced by species uses as probiotics” or more explicit “According to KEGG are any produced by lactobacillus species”
Perplexity Response
None of the listed KEGG compounds appear to be commonly prescribable by MDs as pharmaceuticals. A few are available or derivable as dietary supplements, primarily those related to natural pigments and vitamins found in plants or bacteria.
Available Supplements
Chlorophyll a (KEGG: C05306) is widely sold as a supplement in forms like chlorophyllin for odor control, detoxification, and general health support, often derived from alfalfa or algae.
Ectoine (KEGG: C06231) is offered in over-the-counter supplements, eye drops, and skincare for dry eye relief, skin protection, and anti-inflammatory effects.
Vitamin E Forms
Alpha-tocopherol (KEGG: C02477), beta-tocopherol (KEGG: C14152), alpha-tocotrienol (KEGG: C14153), and beta-tocotrienol (KEGG: C14154) are standard vitamin E components available in tocopherol/tocotrienol supplements for antioxidant and cardiovascular support.
Unavailable Compounds
All others, including bacteriochlorophylls (e.g., C11242, C18155, C21217), complex lipids, CoA derivatives, and specialized bacterial metabolites like archaeal lipids or mycothiol conjugates, show no evidence of commercial supplements or prescriptions; they remain research or biochemical intermediates.
Claude AI Response
Based on my research, I can provide you with information about which compounds from your list are available as supplements or prescribable by physicians. Here’s a summary:
Compounds Available as Supplements:
Chlorophyll a – Available as dietary supplements, typically sold as “chlorophyllin” (a water-soluble derivative with copper instead of magnesium). Available in liquid drops, capsules, and tablets at most health food stores and drug stores WebMDWebMD.
Arachidonate (Arachidonic acid) – Marketed as a dietary supplement, particularly for bodybuilding and muscle growth Wikipedia. Available over-the-counter in capsule form.
Raffinose – Not typically taken as a standalone supplement, though it occurs naturally in foods and may have prebiotic properties Nutrients ReviewWikipedia. Used primarily in research and cryopreservation applications.
Alpha-Tocopherol (Vitamin E) – Widely available as a dietary supplement in capsule, gel capsule, and liquid forms, and can also be prescribed by doctors for certain conditions MedlinePlusWikipedia. In 2023, it was the 290th most commonly prescribed medication in the United States Wikipedia.
Beta-Tocopherol, Alpha-Tocotrienol, Beta-Tocotrienol – Available in mixed vitamin E supplements containing various tocopherols and tocotrienols.
Compounds with Medical/Prescribable Uses:
Bilirubin – Not available as a supplement. Medications like phenobarbital can be prescribed to reduce bilirubin levels in conditions like Crigler-Najjar syndrome and Gilbert’s syndrome Medscape, but bilirubin itself is not supplemented.
D-Xylose – Used primarily as a diagnostic tool in medical testing for malabsorption.
Important Notes:
The vast majority of the compounds on your list are:
Biochemical intermediates in metabolic pathways
Research chemicals
Bacterial/plant-specific compounds
Not available as supplements or prescription medications
Only a very small number (primarily the vitamin E forms, chlorophyll, and arachidonic acid) are commercially available as dietary supplements. I’m not a medical professional, so if you’re considering any of these supplements for health purposes, please consult with a healthcare provider.
This is intended for MD and Researchers
None of the listed KEGG compounds have robust clinical trial validation for therapeutic use. They represent microbiome-derived metabolites with statistically low levels (P < 0.001), suggesting potential biological roles worth exploring in formal trials or under MD supervision.
Key Caveat
Always consult a medical professional before trying any supplement or intervention based on these findings. AI suggestions are not medical advice.
In recent discussions with microbiome startup teams, a key question emerged: which metabolites correlate with specific symptoms? I recommended odds ratios as the optimal analytical approach, and one team is now considering integrating this into their product.
My prior analysis of KEGG-derived metabolite data from various labs revealed stronger consistency in metabolite patterns than bacterial profiles. Symptoms likely arise from adverse metabolite combinations circulating systemically—one metabolite can stem from hundreds of bacteria, and one bacterium can influence hundreds of metabolites—creating a complex web akin to an oversized Gordian knot.
Humans naturally gravitate toward simple “sound bites.” Asked for the highest odds of criminality, people might cite race, city neighborhood, or age range (with 0-5-year-olds showing near-zero risk). True predictive power comes from aggregating all statistically significant odds ratios—in this case, all reported metabolites with meaningful associations.
Using 4500 symptom-annotated samples from BiomeSight, this post explores that approach.
Convert the amount for each metabolite to Percentile ranking. This allows the results to be applied to other pipeline data that may produce different values.
Compute the Chi2 for each integer Percentile rank(100) for each metabolite and symptom (with at least 30 reports, i.e. 207)
2,690 x 100 x 207 = 55,683,000 Chi2 computations
Take the most significant vector with P < 0.001 or Chi2 > 10.83.
Then compute the odds ratio for it
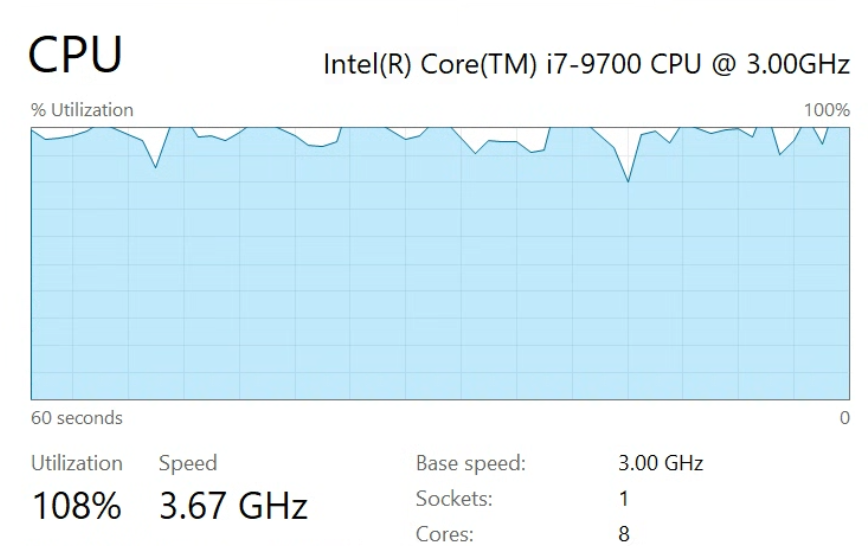
The calculations were brutal with the CPU pegged for days (with some overclocking). If you are running on a cloud service, I trust you have a fat bitcoin wallet.
The results were over 585,094 significant metabolites for our 207 symptoms, or about 1% of the cases has a significant association found.
Using Odds Ratios
Human nature likes simplicity. “Give me just one factor to determine if a person is likely an illegal resident in the USA.” A 2025 report cites there are 150,000 illegal Irish citizens in the US, why is an Irish accent not used as a flag by a certain paramilitary group? With the microbiome data, we suffer a similar bias for simplicity with exclusion of inconvenient facts.
Looking at the odds ratios in detail, we may see large numbers. We should avoid using just one numberin isolation. The table for General: Fatigue is below. For example for the first two, metabolites if one is above and one is below, the resulting Odds ratio is about 1.09 (62.60 * 0.0174), i.e. no major risk. In short all available metabolites should be used, not just one or two.
There is another interesting pattern that arise. Every metabolite is most significant for being present or ot present. This is a natural pattern to use for various machine learning and AI methods, for example
Logistic Regression: Outputs probabilities for binary decisions via sigmoid.
Support Vector Machines (SVM): Finds hyperplanes separating binary classes.
Decision Trees: Splits data into binary paths leading to class labels.
Naive Bayes: Probabilistic classifier assuming feature independence for binary outcomes.
Perceptrons: Single-layer neural nets for linearly separable binary problems.
Random Forests: Ensemble of trees voting on binary predictions
Clinical Use No, Research Use Yes
With a few exceptions, clinical use is limited. For most metabolites there are no easy ways to explicitly, safely, increase or decrease it.
One interesting exception was for C06570: Tetracycline. If this is not seen, then with Chronic Fatigue Syndrome (ME/CFS), the odds of having it is 22x higher. Tetracycline family of probiotics have had significant positive effects on ME/CFS patients. Other similar metabolites include:
Oxytetracycline (C06571)
Chlortetracycline (C11453)
Penicillin G (C06925)
Streptomycin (C04282)
Erythromycin (C06911)
In other words, detecting the absence of naturally occurring antibiotics in a patient with a matching symptom suggests specific antibiotics could be tried.
For items like probiotics, the impact is very strain specific. Very few probiotics are sold by strain (and those that do, often lack data). A simple example for Limosilactobacillus reuteri is illustrated below.
With bacteria Odds ratio I did a “double odds ratio”. A Double Odds ratio means:
Determining Odds ratio for Detected or Not Detected.
Determining the Optimal Odds Ratio when it is Detected.
This was done because I was focused on computing suggestions on individual samples.
These are coarse (single) odds tables because we are not evaluating individual samples but a collection of samples. It is very possible to do a double odds ratio for metabolites — but at present, it appears to have low utilization because of the extremely low number of possible interventions. If interested, contact me at Research at MicrobiomePrescription (US decimal point) com
The reader with Multiple Chemistry Sensitivity(MCS) also has a diagnosed Mast Cell Activation Syndrome (MCAS). We will add this anchorite request. On the symptom list, I will be using a more generic :
After seeing results, I said to myself “This is NOT what I was expecting”. The first thing that I noted was that the number of significant bacteria was at 98%ile, i.e. 98 of 100 symptoms have less significant bacteria. There are a lot of bacteria that are statistically associated with this symptom!
What are we dealing with
Mast Cell Activation Syndrome (MCAS) is thought to stem from abnormally sensitive or dysregulated mast cells that release mediators too easily, often in response to everyday triggers, with genetics, immune dysregulation, and environmental factors all suspected contributors [2024]
My KISS model for symptoms that are statistically significant is that the metabolites (chemicals) released into the body have become unbalanced because the bacteria in the microbiome has become unbalanced. There are several thousands possible metabolites and we lack any in depth studies for the mixtures seen with MCAS.
Existing Common Treatments
All of these are reducing symptom severity and not curing the cause.
Histamine blockade (H1 + H2 antihistamines)
Non‑sedating H1 blockers (e.g., cetirizine, loratadine) plus H2 blockers (e.g., famotidine) are widely used as first‑line and help a large proportion of patients by blocking a key mediator, histamine.
Doses are often higher and more frequent than standard allergy dosing, under medical supervision.
Mast‑cell stabilizers
Cromolyn sodium (especially for GI symptoms) and ketotifen (dual mast‑cell stabilizer + H1 blocker) reduce mediator release and can markedly improve flushing, GI, and some neurologic symptoms over weeks to months.
These are usually added when antihistamines alone are insufficient.
Targeted add‑ons (often leukotriene blockers or biologics) plus trigger control
Leukotriene receptor antagonists (e.g., montelukast) are commonly used to dampen mediator‑driven inflammation, especially in respiratory or systemic symptoms.
In more refractory or IgE‑linked cases, omalizumab (Xolair) is increasingly used off‑label and has helped some patients by reducing IgE‑mediated activation.
Systematic trigger identification and avoidance (food, temperature, chemicals, stress) is considered a core part of effective management in all major reviews.
Digging into our data
I am going to skip the explorations that I did in the earlier posts. As with prior post, Odds Ratio has better fine level identification. We also see a lot more bacteria are identified than with the prior two. There are several thousands possible metabolites and we lack any in depth studies for the mixtures seen with MCAS.
Classic
Odds Ratio
Bacteria Considered
213
298
Bacteria In Common
52
52
Species
20
108
Genus
33
76
Family
54
46
Order
36
34
Class
23
16
What about MCAS occurring with other symptoms? I just put a page up on the odds. Multiple Chemical Sensitivity is reported just 18% of the time, and light sensitivity at 37% of the time. There is not a strong association.
I did a comparison of the net Log(odd ratio) between people. A person without these issues is expected to have a Log(Odds Ratio) < 0. This Post Person reports moderate light sensitivity.
Person
Light Sensitivity
MCS
MCAS
Last Post Person
11.8
17.3
26.1
Anchorite
5.7
16.4
13.8
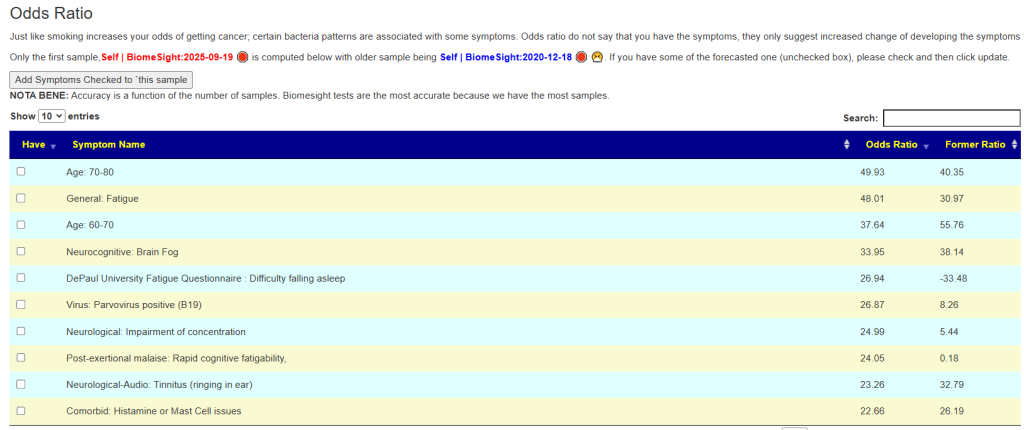
Odds based Suggestions are now available
See this video on how to do it. The following suggestions were computed for the Anchorite. There were 24 bacteria deemed significant with Biomesight data, with the top high one being Mycobacterium
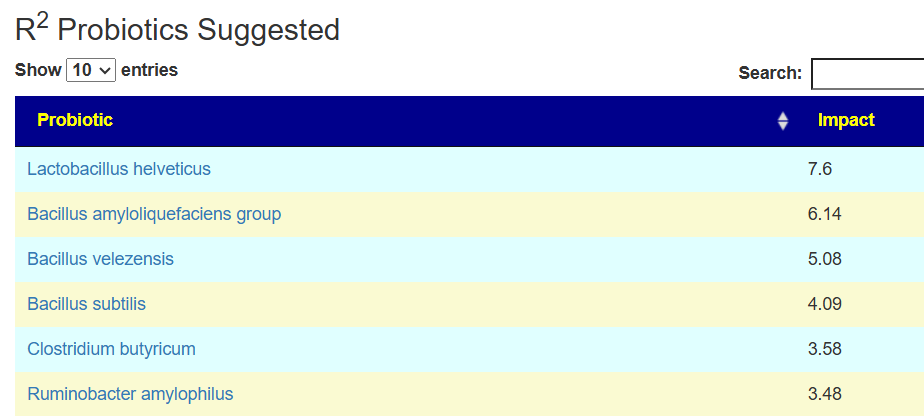
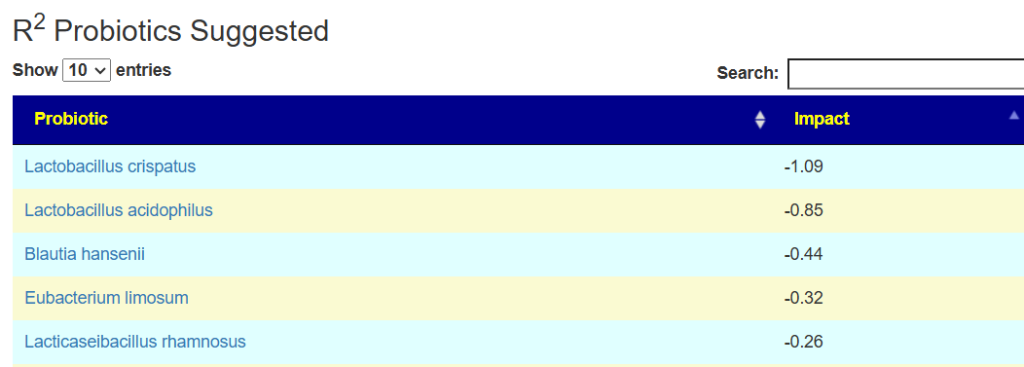
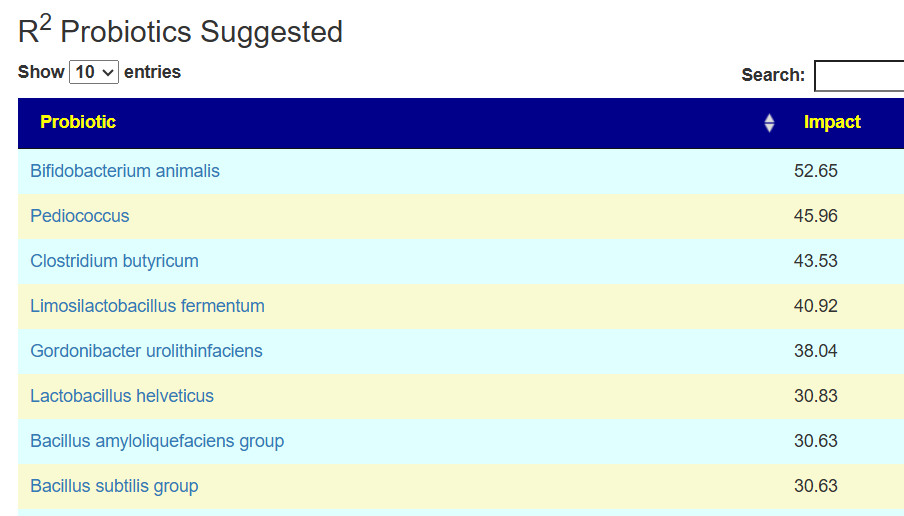
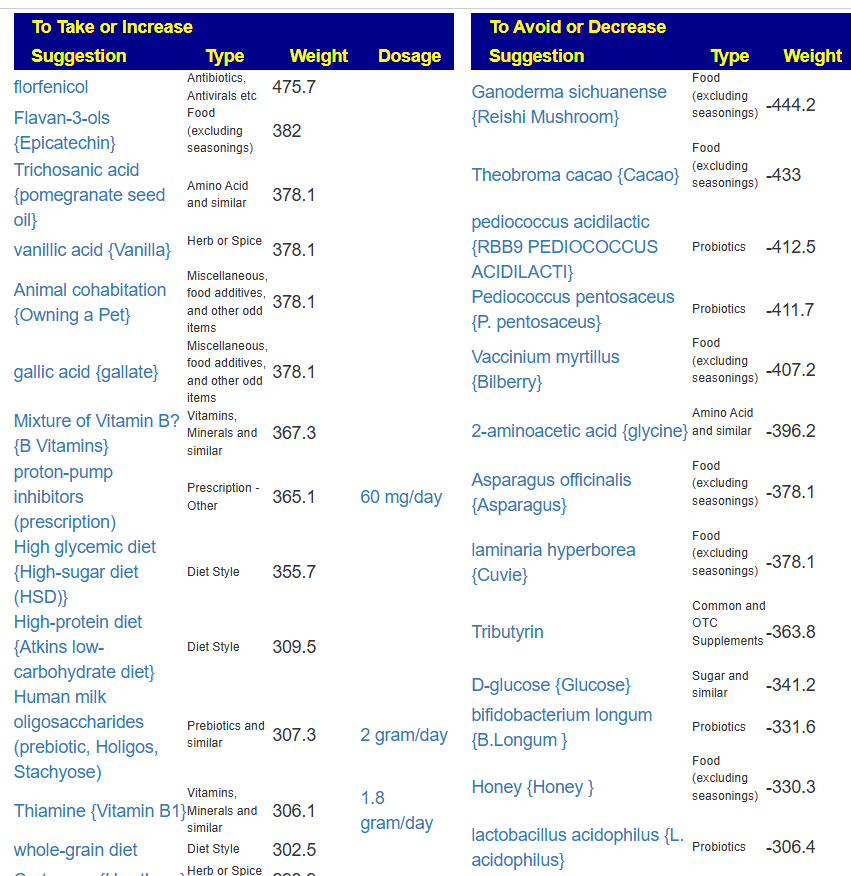
Probiotics to take and avoid
There are no really outstanding recommendations, but three are available and likely worth an experiment.
The suggestions are based on studies from the US National Library of Medicine (PubMed). First, I should point out that Lactobacillus plantarum {L. plantarum} is not in the R2 list because there was not sufficient impact computed. PubMed data is less precise for multiple reasons.
The avoid list is almost 4x longer. I noticed that a lot of herbs and spices are listed as avoid.
Second Opinion using Ombre
The person had done testing with Ombre, then uploaded their FastQ files to Biomesight — so we have two different reports on the bacteria and the amounts. We also have two different sets of Odds Ratio — each is based on a specific testing lab. 101 bacteria were deemed significant with three being especially too high:
We have similarity with to take suggestions. None of the probiotics suggested were on the above list; this is not unexpected because we are using data from the US National Library of Medicine (PubMed) that is a lot less precise and more fuzzy.
As always, when there is disagreement – go with items that there is agreement with.
The to avoid list is shorter here.
Summary
I discussed some of these finding with folks at PrecisionBiome.Eu and they pointed out that herbs are often avoided because of the belief that they contain histamines. An alternative explanation is that they shift the microbiome; in some cases, they may promote sudden cell death with a release of metabolites into the system (i.e. see Jarisch–Herxheimer reaction).
Why herbs are tricky in MCAS
MCAS mast cells are hypersensitive, and many different chemicals, including plant constituents, can trigger degranulation, especially in multi‑ingredient herbal mixes.
Case experience and MCAS guidance note that herbal and “natural” supplements can provoke flares (e.g., some antimicrobial herbs, moringa with high oxalates, concentrated essential oils), so they should be approached like medications, not “automatically safe” foods.
The algorithm that computed suggestions about things to avoid knows nothing about histamines. The calculations are done solely on the bacteria increases and decreases they cause.
This cause the following interpretation speculation of these results:
The likely cause is not enough of good bacteria to keep the bad ones in balance/control
The key word is “balance”
Unless a herb or spice is a strong recommendation, avoid them as much as is practical. There is the appearance that they contribute to inbalance.
The same may be said of antibiotics
Probiotics are unlikely to be a “cure all” with low benefit for most and adverse effects with others
Last item, remember the Microbiome Prescription suggestions are best efforts given the lack of standardization of microbiome tests reporting your results, the lack of standardization of microbiome tests used in published studies, etc. It is a fuzzy logic expert system.
If you have multiple samples, compute suggestions for each one and look for commonality. MCAS is a long duration symptom that persists across multiple samples. Increase your odds by looking for consensus in the To Take, and also aggregate the to avoid into a master list of avoids.
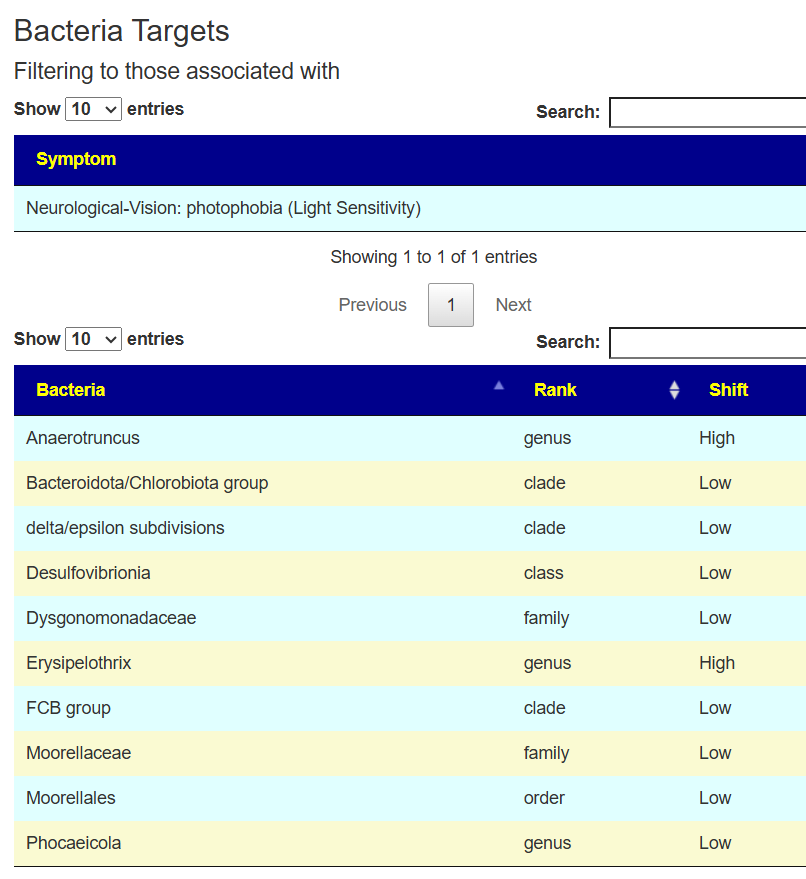
A reader with Multiple Chemistry Sensitivity(MCS) read my Light Sensitivity Exploration post and asked me to look at her sample because her MCS has been getting worse and she is hoping to slow and ideally reverse it. She does not want to become an anchorite with complete isolation from people. On her symptom list it is:
Comorbid: Multiple Chemical Sensitivity
Mast Cell Activation Syndrome (Next Post)
Looking at Comorbidity from our contributed data
14% of people with Photo Sensitivity have MCS, but 89% have MCAS/Histamine issues
17% of people with MCAS/Histamine issues have MCS, but 51% have Photo Sensitivity
Photo Sensitivity
MCS
MCAS
Photo Sensitivity
427
60
383
MCS
238
135
MCAS
753
I am going to skip the explorations that I did in the earlier post. As with prior post, Odds Ratio has better fine level identification.
Classic
Odds Ratio
Bacteria Considered
85
103
Bacteria In Common
17
15
Species
6
37
Genus
16
35
Family
24
13
Order
17
10
Class
10
4
Since Light Sensitivity and MCS tends to go hand in hand, I did a comparison of the net Log(odd ratio) between people. A person without these issues is expected to have a Log(Odds Ratio) < 0. This Post’s anchorite has moderate light sensitivity in reality.
Person
Light Sensitivity
MCS
Last Post Person
11.8
17.3
Anchorite
5.7
16.4
This feature is now available on the web site for samples from Biomesight, Ombre, Thorne and uBiome. How to get to it and use it is shown below.
Probiotics Suggestions for MCS
The full list is below (remember only probiotic bacteria reported by Biomesight are included). The list for the Last Post person for MCS was very similar.
Tax_name
Impact
Bifidobacterium longum
2.22
Bifidobacterium adolescentis
1.92
Enterococcus faecalis
1.89
Bifidobacterium breve
1.83
Clostridium butyricum
1.78
Faecalibacterium prausnitzii
1.73
Streptococcus thermophilus
1.54
Bifidobacterium bifidum
0.89
Bifidobacterium catenulatum
0.8
Ruminobacter amylophilus
0.55
Bifidobacterium animalis
0.51
Bifidobacterium pseudocatenulatum
0.51
Enterococcus durans
0.47
Lactobacillus johnsonii
0.4
Leuconostoc mesenteroides
0.33
Roseburia faecis
0.32
Veillonella atypica
0.23
Lacticaseibacillus paracasei
0.2
Phocaeicola coprophilus
0.18
Bacillus velezensis
0.08
Lactobacillus acidophilus
-0.05
Bacteroides thetaiotaomicron
-0.23
Bacteroides uniformis
-0.3
Limosilactobacillus reuteri
-0.3
Bacillus amyloliquefaciens group
-0.3
Lentilactobacillus parakefiri
-0.31
Phocaeicola dorei
-0.32
Bacillus subtilis group
-0.32
Limosilactobacillus vaginalis
-0.32
Enterococcus faecium
-0.33
Bacillus subtilis
-0.7
Lactobacillus helveticus
-0.85
Lactobacillus jensenii
-0.85
Pediococcus acidilactici
-1.05
I should note that Pediococcus acidilactici is a high take for Light Sensitivity and a take for MCS for the light sensitive person. It is a to be avoided for the Anchorite in both cases. This goes back to the old saying “No probiotics can serve two people with the same symptoms” (Matt 6:24, Microbiome Translation).
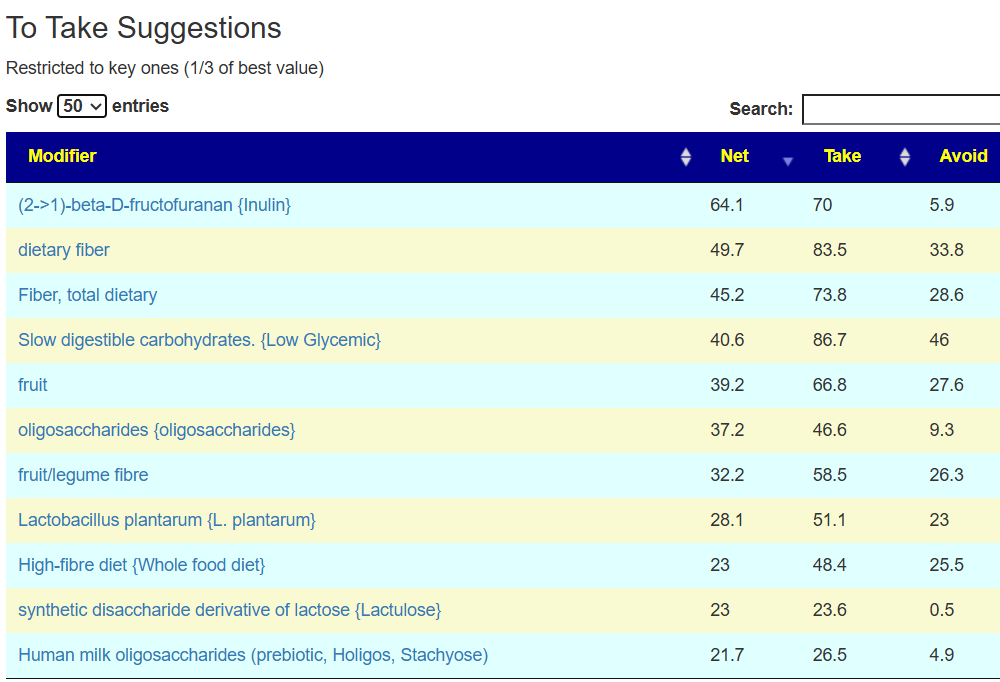
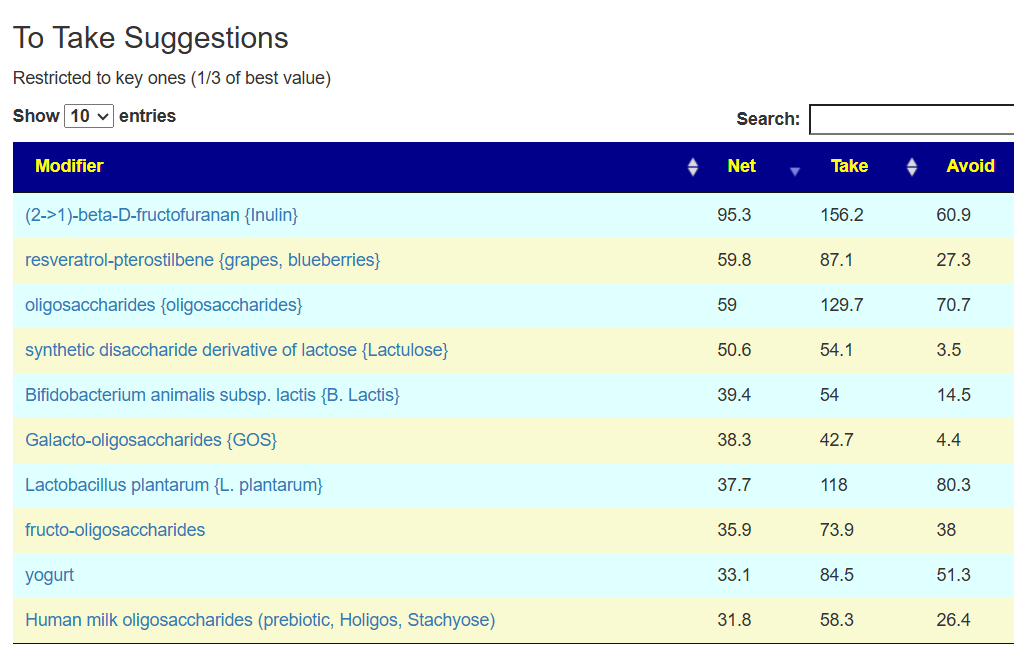
Take Suggestions
These match the general pattern seen for Long COVID and ME/CFS
Modifier
Net
Take
Avoid
(2->1)-beta-D-fructofuranan {Inulin}
133
137
4
dietary fiber
82
106
25
oligosaccharides {oligosaccharides}
78
90
12
Slow digestible carbohydrates. {Low Glycemic}
77
106
29
Fiber, total dietary
69
91
21
fruit
60
80
21
Lactobacillus plantarum {L. plantarum}
50
67
18
fruit/legume fibre
48
67
19
fructo-oligosaccharides
48
51
3
synthetic disaccharide derivative of lactose {Lactulose}
46
48
2
Human milk oligosaccharides (prebiotic, Holigos, Stachyose)
38
46
8
Cichorium intybus {Chicory}
36
39
3
wheat
35
40
6
Hordeum vulgare {Barley}
34
44
11
whole-grain diet
33
46
13
ß-glucan {Beta-Glucan}
33
38
5
High-fibre diet {Whole food diet}
32
48
16
Bovine Milk Products {Dairy}
32
46
13
resistant starch
32
40
8
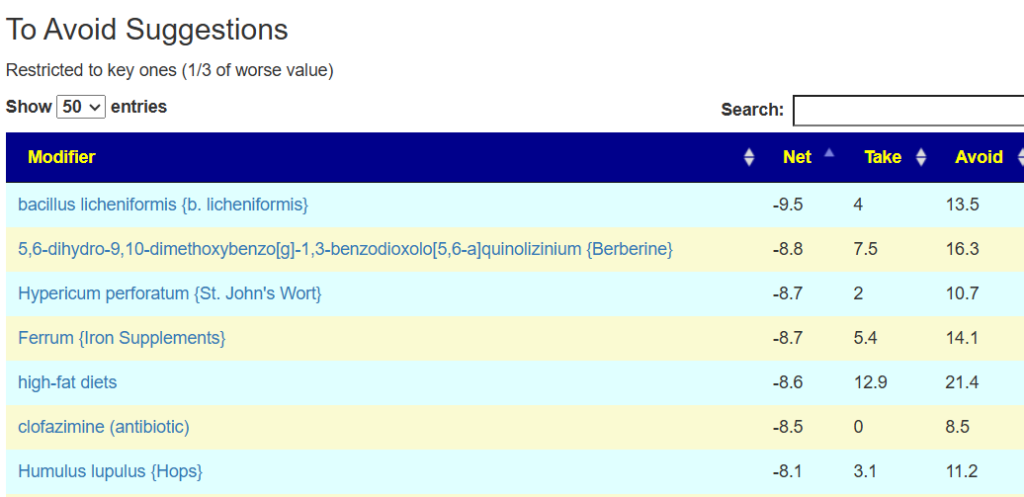
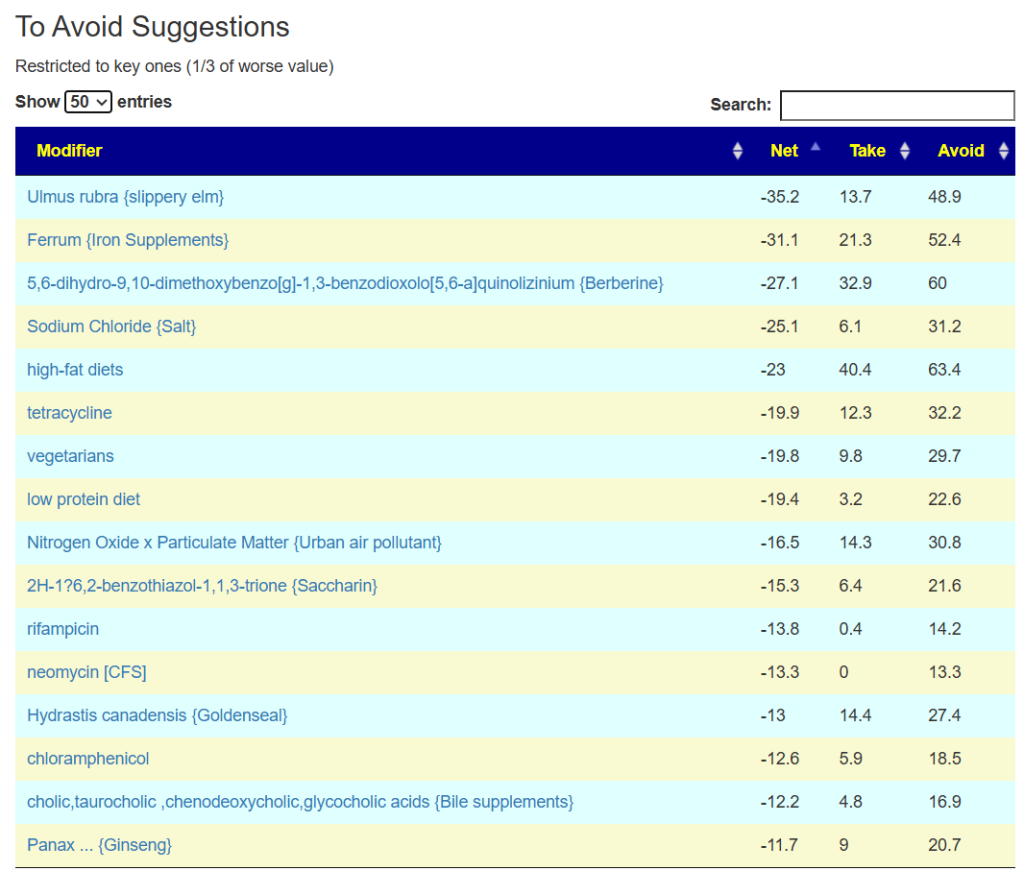
Avoid Suggestions
We have a few herbs or spices showing up as an avoid. When we look at MCAS, we see a very atypical avoid list.
Nitrogen Oxide x Particulate Matter {Urban air pollutant}
-6
2
8
High-protein diet {Atkins low-carbohydrate diet}
-6
4
10
vegetarians
-6
4
10
low fodmap diet
-6
8
15
Azadirachta indica {Neem}
-4
0
4
Silver nanoparticles {Colloidal silver}
-4
0
4
Summary
The new offering is easy to use, just follow the video above. Remember, most symptoms are caused by combinations of bacteria that alters the metabolites (chemicals) that the body gets. There are many distinct combinations that can produce a symptom. Above is NOT a general guidance, it shows the results for a specific person using their microbiome. The suggestions for your microbiome may be different. Testing is not optional if you want to make progress.
My daughter’s light sensitivity is now so bad, she’s screaming in pain at daylight and won’t let her flatmate put up the blinds! Of course it’s related to her autism. Now we’ve uploaded her new sample, is there anything implicated in her current dysbiosis that might lessen this? She is tormented by this..
I believe we just have enough data to get some traction. I will first use the new Odds Ratio because it give an objective measurement of the importance of each bacteria. Second, I will use the older methodology to simply get a second opinion of which bacteria (unfortunately, this does not indicate importance of each bacteria).
There are three symptom choices related. The difference in count is a reflection of when the symptom was added (the earliest one had the highest count).
DePaul University Fatigue Questionnaire : Abnormal sensitivity to light 259 samples
Other:Light sensitivity (photophobia) 5
The sample above was done using biomesight and we have 148 different bacteria using Odds that are statistically significant for increasing or reducing the odds.
The Odds of her having light sensitivity is quite high: log(Odds)=11.8,
These notes document ongoing work on this issue. The goal is both to address her request and to deepen our understanding of how the MP classic method compares to the newer Odds Ratio approach. The MP classic method has produced good results so far, and Odds Ratios may further improve them. For details on how Odds Ratios are calculated, see this related post: Odds Ratio for the Microbiome 101.
In subsequent posts I will look at two symptoms that are very often seen with light sensisitivy:
Multiple Chemical Sensitivity
Mast Cell Activation Syndrome
Comparison of “MP Classic” and Odds Ratio Algorithms
Across all symptoms, using Biomesight data, we see consistent patterns in which bacterial levels are involved. The Odds Ratio analysis focuses on more specific bacterial taxa and is therefore more targeted. For example, instead of simply indicating low Lactobacillus, the Odds Ratio can highlight a particular species such as Lactobacillus reuteri. This higher resolution enables more precise selection of probiotics.
Taxonomy Rank
MP Classic
Odds Ratio
Species
1727
13541
Genus
5130
10040
Family
8463
6158
Order
5860
3269
Class
3663
1437
Overview of all Samples
The list of bacteria that DOUBLES or more the odds when present in larger amounts
Bacteria
Rank
Odds Ratio
Salidesulfovibrio
genus
5.9
Salidesulfovibrio brasiliensis
species
5.9
Ethanoligenens
genus
4.9
Peptoniphilus lacrimalis
species
4.3
Slackia faecicanis
species
4.2
Collinsella tanakaei
species
3.8
Finegoldia magna
species
3.5
Viviparoidea
superfamily
3.5
Architaenioglossa
order
3.5
Rivularia
genus
3.5
Viviparidae
family
3.5
Rivularia atra
species
3.5
Rivularia
genus
3.5
Finegoldia
genus
3.4
Lysobacter
genus
3.4
Desulfovibrio fairfieldensis
species
3.3
Aerococcaceae
family
3.3
Anaerococcus
genus
3.2
Streptococcus anginosus
species
3.1
Luteolibacter
genus
3
Luteolibacter algae
species
3
Anaerotruncus colihominis
species
3
Odoribacter denticanis
species
3
Filifactor
genus
2.8
Lactobacillus gallinarum
species
2.8
Peptoniphilus asaccharolyticus
species
2.8
Selenomonas infelix
species
2.7
Corynebacterium striatum
species
2.7
Adlercreutzia equolifaciens
species
2.6
Streptococcus anginosus group
species group
2.6
Glutamicibacter soli
species
2.6
Anaerotruncus
genus
2.5
Rubritaleaceae
family
2.5
Rubritalea
genus
2.5
Gardnerella
genus
2.4
Oscillatoriales
order
2.3
Amedibacillus dolichus
species
2.3
Amedibacillus
genus
2.3
Glutamicibacter
genus
2.2
Anaerococcus prevotii
species
2.2
Azospirillum palatum
species
2.2
Eggerthella sinensis
species
2.2
Sphingomonas abaci
species
2.2
Alcanivorax
genus
2.1
Alcanivoracaceae
family
2.1
Haploplasma
genus
2.1
Haploplasma cavigenitalium
species
2.1
Isoalcanivorax
genus
2.1
Isoalcanivorax indicus
species
2.1
Oscillatoriaceae
family
2.1
Selenomonadales
order
2.1
Nisaea nitritireducens
species
2.1
Anaerococcus tetradius
species
2.1
Selenomonadaceae
family
2.1
Lactobacillus acidophilus
species
2.1
Anaerococcus lactolyticus
species
2.1
On the other end, the bacteria that reduces the odds when present in higher amounts are:
Propionibacteriales
order
0.1
Dyadobacter
genus
0.3
Herbaspirillum magnetovibrio
species
0.3
Calditrichia
class
0.4
Calditrichales
order
0.4
Calditrichaceae
family
0.4
Caldithrix
genus
0.4
Calditrichota
phylum
0.4
Desulfitobacteriaceae
family
0.4
Bifidobacterium adolescentis
species
0.4
Bifidobacterium longum
species
0.4
In terms of probiotics, we see some quick observations: good and bad.
Two Lactobacillus probiotics significantly increases the odds — i.e. AVOID, especially yogurts!
Two Bifidobacterium species (and the genus as a whole) significantly decreases the odds — TAKE A LARGER DOSAGE.
Looking at this specific sample
We found no lactobacillus at all, and Bifidobacterium adolescentis is too low. Bifidobacterium longum was found but the amount was significant for reducing the risk.
Getting best probiotics via modelling
This is done using the Correlation Coefficient between bacteria from the R2 site (using the lab specific numbers). We focused solely on the bacteria that increased the odds significantly, and then compute the probiotics (based on only the species what Biomesight reports) that will shift them in the right direction.
Tax_name
Impact
Pediococcus acidilactici
4.28
Bacillus amyloliquefaciens group
3.89
Limosilactobacillus vaginalis
2.95
Bifidobacterium
2.5
Enterococcus faecalis
1.73
Bifidobacterium pseudocatenulatum
1.6
Leuconostoc mesenteroides
1.6
Heyndrickxia coagulans (bacillus coagulans)
1.53
Bifidobacterium longum
1.49
Clostridium butyricum
1.46
Lacticaseibacillus paracasei
1.35
Lactococcus lactis
1.33
Bifidobacterium breve
1.28
Lactobacillus helveticus
1.27
Enterococcus faecium
1.24
Bacillus subtilis group
1.16
Lactiplantibacillus plantarum
1.08
Bifidobacterium bifidum
0.96
Bifidobacterium adolescentis
0.84
Taking these same bacteria using the odds ratios and our usual suggestions engine, we get the following as the top suggestions.
Modifier
Net
Take
Avoid
Slow digestible carbohydrates. {Low Glycemic}
37
52
16
dietary fiber
29
45
16
Fiber, total dietary
24
38
14
fruit
22
34
12
fruit/legume fibre
20
32
12
(2->1)-beta-D-fructofuranan {Inulin}
20
23
3
High-fibre diet {Whole food diet}
19
32
13
oligosaccharides {oligosaccharides}
19
26
6
whole-grain diet
18
25
7
Lactobacillus plantarum {L. plantarum}
17
29
12
bifidobacterium
15
16
1
wheat
12
14
2
The Avoids. I noticed that Bofutsushosan is an avoid. This is a promoter of Akkermansia — which was on our avoid probiotics list. There appears to be reasonable consistency although we are using two different sources and mechanism to get these suggestions.
Modifier
Net
Take
Avoid
high-fat diets
-8
3
11
Ganoderma sichuanense {Reishi Mushroom}
-5
1
6
Pulvis ledebouriellae compositae {Bofutsushosan}
-4
0
5
2-aminoacetic acid {glycine}
-4
0
4
Bacteriophages LH01,T4D,LL12,LL5 {PreforPro}
-4
0
4
laminaria hyperborea {Cuvie}
-4
0
4
low protein diet
-4
1
6
D-glucose {Glucose}
-4
1
6
Ferrum {Iron Supplements}
-4
1
5
Ulmus rubra {slippery elm}
-4
2
6
Honey {Honey }
-4
2
6
Going Old School Suggestions
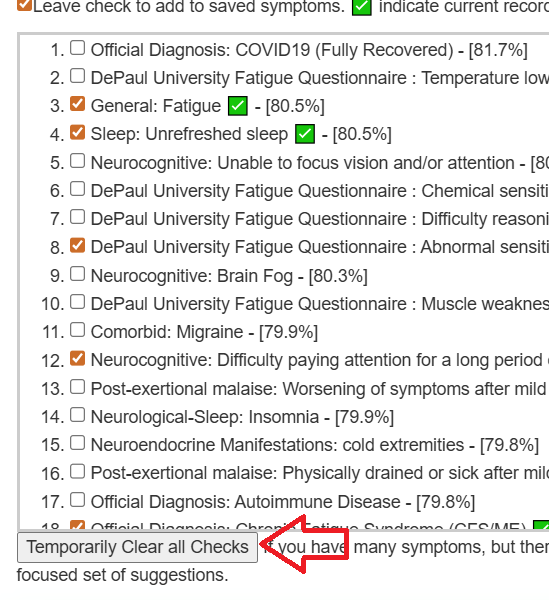
This is done the usual way but we temporarily clear all of the symptomsand then just marked this single symptom. We are wanting to focus solely on this one horrible symptom.
Clicking on this one symptom, we then get 10 bacteria associated
And also suggestions. I note some agreements between the methods:
Disagreement: Bifidobacterium Longum – this gets interesting because the Odds Ratio indicate that the amount of Bifidobacterium Longum present was sufficient to reduce the odds to below 1.0
Summary
I generally favor a consensus of recommendations as the safest course. In this case, my impression is that using Odds Ratios leads to better identification of the bacteria involved (10 versus 24 for this sample), with the added benefit of indicating the relative importance of each bacterium. With Odds Ratios, the thresholds for being too high or too low are symptom-specific, rather than some magical universal cutoff that applies to all conditions.
Believing that there is one magic reference range for any bacteria is simply naive and ignoring the data.
I need to do some more refining of the code as well as enhancement to handle multiple symptoms concurrently; in time, this will be added to the sight.
Using Odds Ratio is now available on the site. The video below shows how to access it.
Technical Notes
Doing a low level comparison between the “classic forecast method” and the “Odds Ratio method I generated the table below. The Odds Ratio identified bacteria at a much more at a finer level (species) and most people would interpret that as being more targeted and likely better outcomes.
Measure
Classic
Odds Ratio
Bacteria Considered
115
148
Bacteria in common
20
20
Species
8
57
Genus
22
51
Family
33
21
Order
23
10
Class
14
3
This also implies that only Genus and Species should be considered with Odds Ratio. Statistically this is preferred to reduce the amount of double counting.
Revisiting Suggestions using only Genus and Species with Odds Ratio
The R2 Probiotics are similar. Most probiotics are more challenging to obtain — see this page for known sources. The avoids are:
Lactobacillus johnsonii
Akkermansia muciniphila
Bacillus subtilis
Note: Pediococcus acidilactici and L.Plantarum (positive) mixtures is likely the easiest to obtain.
By Kenneth Lassesen, B.Sc.(Statistics), M.Sc.(Operations Research)
Odds Ratio and Chi2 are two sides of the same coin. The worth of this coin is far more than the fourréesseen with studies using averages.
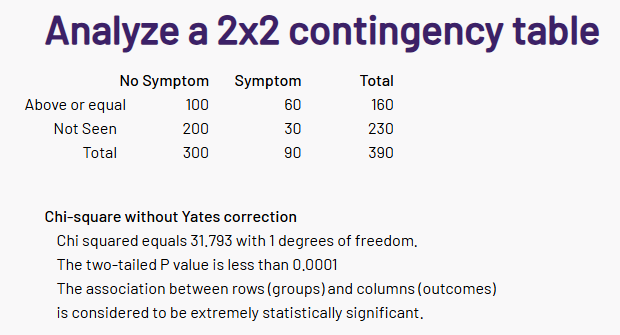
The simplest case is how often is a specific bacteria reported with the control versus study groups. This is easy computed and can be placed in a table such as the one below
Control (without Symptom)
Study (or with Symptom)
Bacteria Seen
300
90
Bacteria Not Seen
600
700
Just looking at the table, it is obvious that this bacteria is less likely to be seen in a study group. We can just drop these numbers in a page like this one, and get the results.
Converting to odds ratio is simple:
Compute odds for study group: 90300=3.333.
Compute odds for control group: 700600≈0.857.
Odds ratio: that seeing this bacteria put you likely not in the study group
Or 1/3.89 = 0.257 if seeing this bacteria, places you in the study group
Second Tier: The amount
This is identical to the above, except there is a little mathematics needed to compute the best range of bacteria for odds ratio.
At 0.04%
Control (without Symptom)
Study (or with Symptom)
Above or Equal
100
60
Below
200
30
Again a simple computation with great statistical significant.
And again the Odds Ratio is calculated the same as above.
100/60 = 1.66
200/30 = 6.66
OR = 1.66 / 6.66 = 0.25 (or 4.00 for the reverse.
We have a tri-state odds ratio
Bacteria not seen: 0.257 of having symptom (i.e. bacteria is rarely seen with symptom)
Bacteria see but above or equals to 0.04%: 3.89 * 4 =15.56
Bacteria see but below 0.04%: 3.89 * .25 = 0.9725, almost no effect.
In this example, we used above or below 0.04%; we could have also used in the range (0.03 to 0.07) or not in the range.
Key points
Use only bacteria with P < 0.001 or better
Check Present or not Present
There is a finite enumeration of possible ranges when a bacteria present.
With today’s powerful computers, this is not a challenge
Check all bacteria that satisfies the minimum size constraint for the function used for the 2×2 table
For some symptoms we have:
over 450 bacteria with significant odds ratios for some conditions.
Highest Odds ratio over 92 for some bacteria
Performance
This data is based on self-declared symptoms from users. Often the symptoms entered are incomplete (some users had over 100 symptoms entered). While not rigorous, this appears to work for getting sample annotations entered in a citizen science context and for demonstration of the concept. There was enough consistency of data to get results.
The best news: The following had the Odds Ratio > 1.0, over a dozen in the sampling and agreement with entered symptoms.
Source
SymptomName
Accurate %
BiomeSight
Official Diagnosis: Mood Disorders
100
Thryve
DePaul University Fatigue Questionnaire : Frequently get words or numbers in the wrong order
100
Thryve
Autism: More Repetitive Movements
100
Thryve
Autonomic Manifestations: cardiac arrhythmias
100
Thryve
Condition: Acne
100
Thryve
DePaul University Fatigue Questionnaire : Pain in Multiple Joints without Swelling or Redness
100
Thryve
DePaul University Fatigue Questionnaire : Feeling like you have a temperature
100
Thryve
Official Diagnosis: Diabetes Type 1
100
Thryve
Neurological: Spatial instability and disorientation
Looking at the biggest sets. we see very good performance for some symptoms and poor performance for items like gender. Unrefreshing Sleep is interesting:
Unrefreshed sleep: 88.6% accurate
Unrefreshing Sleep, that is waking up feeling tired: 36.7% accurate
Is the cause, the fineness of definition (and lack of clarity by users entering) or some other issues?
Source
Symptom
% Correct
Size
BiomeSight
General: Fatigue
98.70317
694
BiomeSight
Neurocognitive: Brain Fog
98.18182
660
BiomeSight
Sleep: Unrefreshed sleep
88.57616
604
BiomeSight
Neurocognitive: Difficulty paying attention for a long period of time
75.54113
462
BiomeSight
Immune Manifestations: Bloating
90.13761
436
BiomeSight
DePaul University Fatigue Questionnaire : Fatigue
85.96491
399
BiomeSight
Gender: Male
59.79644
393
BiomeSight
Comorbid: Histamine or Mast Cell issues
88.0102
392
BiomeSight
Official Diagnosis: COVID19 (Long Hauler)
97.87798
377
BiomeSight
DePaul University Fatigue Questionnaire : Unrefreshing Sleep, that is waking up feeling tired
36.66667
360
BiomeSight
Neurocognitive: Can only focus on one thing at a time
63.76404
356
BiomeSight
Neuroendocrine Manifestations: worsening of symptoms with stress.
70.26239
343
BiomeSight
Neurological-Audio: Tinnitus (ringing in ear)
60.71429
336
BiomeSight
Neurocognitive: Problems remembering things
47.00599
334
BiomeSight
Age: 30-40
97.14286
315
BiomeSight
DePaul University Fatigue Questionnaire : Post-exertional malaise, feeling worse after doing activities that require either physical or mental exertion
92.33227
313
BiomeSight
Neurocognitive: Absent-mindedness or forgetfulness
62.7907
301
BiomeSight
Sleep: Daytime drowsiness
69.33333
300
BiomeSight
Post-exertional malaise: General
85.95318
299
BiomeSight
Immune Manifestations: Constipation
83.22148
298
Lab Performance
Identification by Age exhibits the reality of all labs are not equal. If Odds Ratios from the microbiome was not statistically significant for estimating age, we would see 14% for accuracy. We far exceed that.
Lab
Symptom
Accuracy
Size
BiomeSight
Age: 0-10
86.2
29
Ombre
Age: 0-10
76.3
59
BiomeSight
Age: 10-20
80
25
Ombre
Age: 10-20
94.7
19
BiomeSight
Age: 20-30
58.5
135
Ombre
Age: 20-30
64.7
34
BiomeSight
Age: 30-40
97.1
315
Ombre
Age: 30-40
66.3
104
BiomeSight
Age: 40-50
22.2
203
Ombre
Age: 40-50
71.4
63
BiomeSight
Age: 50-60
29.7
111
Ombre
Age: 50-60
61.7
47
BiomeSight
Age: 60-70
52.5
59
Ombre
Age: 60-70
18.1
83
BiomeSight
Age: 70-80
90
20
This difference of labs is seen with other symptoms — some of which has associations reported in the literature.
Source
SymptomName
Ratio
Size
BiomeSight
General: Depression
67.7
195
Ombre
General: Depression
13.9
108
BiomeSight
General: Fatigue
98.7
694
Ombre
General: Fatigue
20.8
149
BiomeSight
General: Headaches
71.6
197
Ombre
General: Headaches
15.5
103
Summary
The use of odds ratios provides statistically significant evidence for identifying probable symptoms. While not definitive—acknowledging that few diagnostic tests achieve complete certainty—the results demonstrate that both the selected testing method and its interpretation (for example, in relation to bacterial associations) materially influence diagnostic accuracy.
In clinical contexts, reliance on odds ratios offers greater methodological rigor than studies reporting merely “higher or lower levels of certain bacteria with .” A notable clinical strength of this approach lies in its capacity to generate a structured list of potential symptoms for further inquiry, including those that patients may not have initially disclosed.
Nota Bene: It should be noted that the observed error rate is likely attributable, at least in part, to underreporting of symptoms. Patients often disclose only the symptoms they perceive as most severe, thereby introducing reporting bias into the dataset.
The table below shows the accuracy from 4 different labs. It is not a surprise that Shotgun data is more accurate than 16s tests.
I just pushed a new feature that is shown in the video below
The differences of the two methods are:
Old method looks at the level of bacteria that you have only. This is ideal for making suggestions because we want to alter what is there.
New, Odds Ratio method, looks at which bacteria were found (or missing) and their levels. Addressing missing bacteria is not trivial — unless it is a known probiotics species (99% are not)
Odds Ratio is likely more accurate because it considers what is there, the amount and what is missing. It is not an ideal choice for computing suggestions.
Remember Odds Ratios do not say you will have a symptom, it merely indicates increased odds of having the symptom.
Example below of two samples taken 5 years apart. Earlier sample, patient was 68, later sample 73. In general reflects well the symptoms reported.
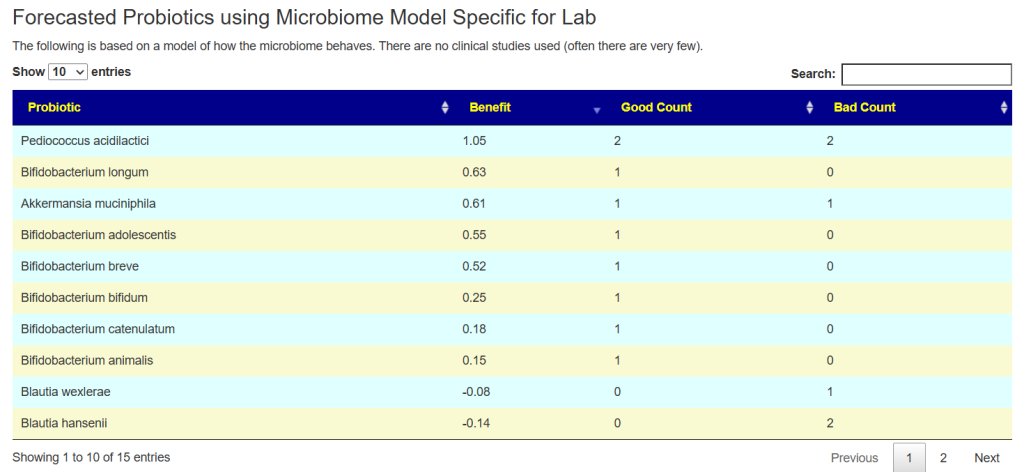
For many months, using R2 Associations to select probiotics used a generic database from PrecisionBiome. Over the year end holidays, I computed the R2 Associations based on data from specific labs. This is far more accurate and have just been added for the following labs:
Biomesight (best because biggest dataset)
Ombre
uBiome
Thorne (smallest dataset and not as much data).
At the bottom of the suggestion page you will see a new section like below:
The range of numbers can vary greatly.
Which is best? We have multiple ways of computing probiotics. The ideal would be to do only ones that each way advocates. When there are Good and Bad counts, having a positive good and zero for bad is ideal.
The reality is that this rarely happens. I tend to favor Good count much bigger than Bad with a high positive benefit. Our knowledge is sparse and often studies results fail to duplicate. I tend to favor this method because it is an Fuji apple to Fuji apple comparison instead of the Crab Apple to Watermelon comparison that published studies tend to be.
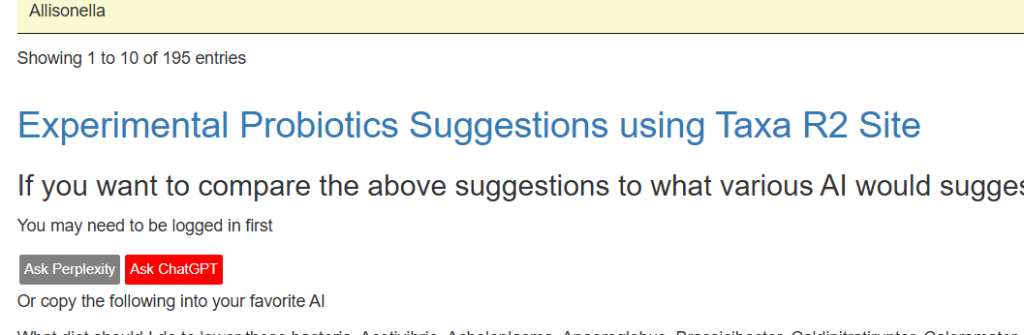
A reader forwarded a Bulgaria supplier site to me. I was delighted to see their offerings!
Probiotics availability is a complex area with national laws restricting access. A good example is the US: if you are not producing a grandfathered species then there is a massive amount of testing to get approved for sale. A good example is Mutaflor, E.Coli Nissle 1917, which cannot be sold in the US despite a literal century of safe use in Europe.
This is further complicated because a probiotic claiming to be a specific species may be tested and depending on the test used be found to not be there, a different species or as claimed. There is no standardization of microbiome testing See this post for the background.
In most of Western Countries, there is a huge profit margin for probiotics, 10x or 20x the cost of production is not unusual. Often manufacturers will often prevent the import of foreign probiotics citing safety or lack of “in country safety tests”. Some people may find that they cannot import those below.
Bottom line: I take claims of species in a probiotic on face value. See bottom on selecting probiotics given a microbiome sample; most of these have very few clinical studies in English. I will be adding these to the probiotic search page over the next week.
The predicted / model impact of each probiotic above can be estimated from this page.
Over the next week, I will attempt to add modelled impact on each of these combinations on a microbiome sample using the link below on the suggestions page.

Recent Comments