Conventional medical science tend to think of one bacteria to one condition. These are known as Single-Bacterium Diseases.
Single-Bacterium Diseases
- Tuberculosis — caused by Mycobacterium tuberculosis
- Diphtheria — caused by Corynebacterium diphtheriae
- Cholera — caused by Vibrio cholerae
- Leprosy (Hansen’s disease) — caused by Mycobacterium leprae
- Whooping cough (Pertussis) — caused by Bordetella pertussis
- Tetanus — caused by Clostridium tetani
- Typhoid fever — caused by Salmonella typhi
- Syphilis — caused by Treponema pallidum
- Gonorrhea — caused by Neisseria gonorrhoeae
- Lyme disease — caused by Borrelia burgdorferi
- Gastric ulcer — caused by Helicobacter pylori
- Strep throat — caused by Streptococcus pyogenes
- Urinary tract infection — most commonly caused by Escherichia coli
- Pneumonia — can be caused by Streptococcus pneumoniae
- Meningitis — can be caused by Neisseria meningitidis (meningococcus), or Streptococcus pneumoniae
- Bacterial vaginosis — often caused by Gardnerella vaginalis
There are other conditions that could be cause by any one of several bacterium, but not bacterium cooperating with each other.
When we enter the world of microbiome dysbiosis, this simplicity disappears.
Case Study of number of bacterium associated with many symptoms
We return to our collection of 4,290 unique samples with 327 symptoms having statistical significant bacterium discussed in Significant Bacteria and Their Thresholds – Part 1. Restricting our data to associations with P < 0.01, the graph below shows the number of bacteria associated with each symptom.
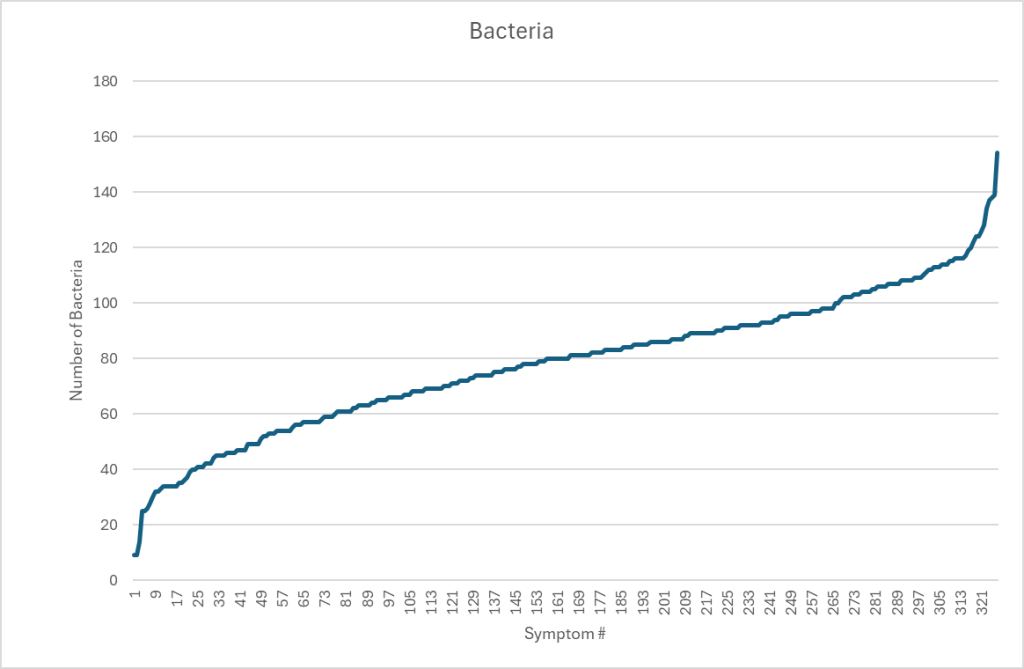
My view is that symptoms arise from the metabolites produced by a specific combination of bacteria. Examining the data from KEGG: Kyoto Encyclopedia of Genes and Genomes, we see that some metabolites can be produced by hundreds of different bacterium. Some bacteria associated with a symptom may actually be due to secondary effects—reflecting shifts caused by other species—so distinguishing causal bacteria from merely correlated ones remains difficult.
A practical working hypothesis for reducing or eliminating a symptom is therefore to normalize the bacteria associated with it. A rational approach is to start with those that have the strongest association.
The Naïve Approach
A well-educated medical professional typically follows this reasoning:
- Identify which bacteria are outside the normal range and linked to the patient’s symptoms.
- Determine whether each bacterium is elevated or reduced.
- Review substances known to influence these bacteria.
- Recommend lifestyle or dietary changes based on those substances.
In practice, certain substances may be counter-indicated for other bacteria that are also out of range. This is often overlooked, as many professionals adopt a “find the first substances that address the bacterium shift” approach. This sometimes makes the patient worse.
Microbiome Prescription uses a manually curated database containing over 7.4 million relationships between substances and specific bacteria. Because of this depth, these potential conflicts are often identified and the risk of adverse effects is reduced.
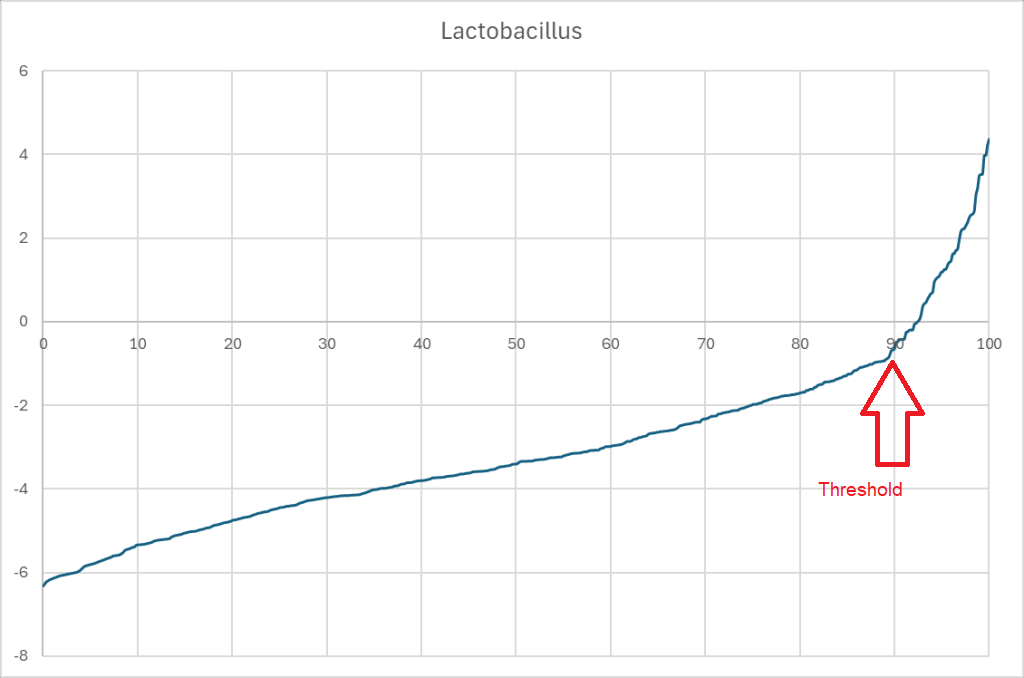
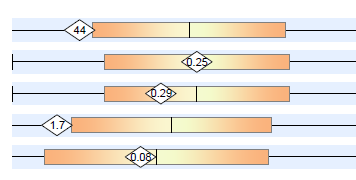
A professional in this situation would reasonably expect to see a chart such as the one below for each of the bacterium associated with a symptom. The chart, table or other items giving a desired range of values.
With dozens of bacteria out of range, there is no clear objective ability to rank these bacteria by importance. There are a variety of speculative punts that could be tried:
- Rank them by the volume of bacteria
- Rank them by the deviation from the reference range, i.e.(value – mean)/standard deviation
- Rank them by any of many possible algorithms that could be tossed at this issue.
Turning the issue upside down
Let us take the concrete example promised in the earlier post: Long COVID. We have 538 samples with Long COVID in our population of 4,290 contributed samples. This is about 12% of the samples.
Filtering the associations to those bacterium with P < 0.0001; our highest priority or weight. We obtain the table below. While there are many bacteria, some are tightly related according to lineage:
Mycoplasmatota; Mollicutes; Anaeroplasmatales; Anaeroplasmataceae; Anaeroplasma
| Taxon | tax_name | tax_rank |
| 1737405 | Tissierellales | order |
| 626933 | Odoribacter laneus | species |
| 186332 | Anaeroplasmatales | order |
| 186333 | Anaeroplasmataceae | family |
| 85630 | 16SrX (Apple proliferation group) | species group |
| 102260 | 16SrXV (Hibiscus witches’-broom group) | species group |
| 47565 | Candidatus Phytoplasma prunorum | species |
| 2086 | Anaeroplasma | genus |
Filtering the associations to those bacterium with P < 0.001; we get a second table shown below. One of the bacteria is Lactobacillus jensenii, which is available as a probiotic (I have some in my fridge) — but we do not know if we want to increase or decrease this bacteria.
| Taxon | tax_name | tax_rank |
| 2330 | Halanaerobium | genus |
| 1381 | Atopobium minutum | species |
| 972 | Halanaerobiaceae | family |
| 724 | Haemophilus | genus |
| 194 | Campylobacter | genus |
| 28128 | Prevotella corporis | species |
| 72294 | Campylobacteraceae | family |
| 33037 | Anaerococcus vaginalis | species |
| 38288 | Corynebacterium genitalium | species |
| 42857 | Moorella group | norank |
| 45254 | Dysgonomonas capnocytophagoides | species |
| 45404 | Beijerinckiaceae | family |
| 47420 | Hydrogenophaga | genus |
| 102261 | Candidatus Phytoplasma brasiliense | species |
| 109790 | Lactobacillus jensenii | species |
| 89061 | Weissella thailandensis | species |
| 215579 | Schlegelella | genus |
| 382673 | Syntrophomonas cellicola | species |
| 386414 | Hoylesella timonensis | species |
| 1963360 | Parachlamydiales | order |
| 1853231 | Odoribacteraceae | family |
We could continue onwards and look at the 40 bacterium associated with P < 0..01 and 48 bacterium with P < .05. While potentially important, because of the lesser degree of association, we will ignore them here. My preference is always to favor highest probability and thus would only look at those in the above two tables.
Question: Is Lactobacillus Jensenii too high or too low
Some medical practitioners would hear the word “Lactobacillus” and immediately say “Take it” because they have a (questionable) belief that Lactobacillus will help everything! Is this the case here?
The Data for Lactobacillus Jensenii
The table below shows the data. The percentages have been transformed to percentiles for better presentation with a count of the occurrences at each. One of the first items some people will note is that this bacterium is not reported often; but there is enough data to get a P < 0.001 using Chi2 . I disagree with the approach seen in some papers, to only examine very commonly reported bacterium.
| %-ile Range | HasTotal | HasNotTotal |
| Not Present | 344 | 3852 |
| 0.00 | 1 | 3 |
| 4.21 | 0 | 15 |
| 20.00 | 2 | 22 |
| 45.26 | 2 | 13 |
| 61.05 | 1 | 3 |
| 65.26 | 0 | 3 |
| 68.42 | 0 | 3 |
| 71.58 | 0 | 5 |
| 76.84 | 0 | 2 |
| 78.95 | 1 | 1 |
| 81.05 | 0 | 1 |
| 82.11 | 1 | 0 |
| 83.16 | 1 | 0 |
| 84.21 | 0 | 1 |
| 85.26 | 0 | 2 |
| 87.37 | 0 | 1 |
| 88.42 | 0 | 1 |
| 89.47 | 1 | 0 |
| 90.53 | 0 | 1 |
| 91.58 | 1 | 0 |
| 92.63 | 1 | 0 |
| 93.68 | 0 | 1 |
| 94.74 | 0 | 1 |
| 95.79 | 0 | 1 |
| 96.84 | 0 | 1 |
| 97.89 | 0 | 1 |
| 98.95 | 0 | 1 |
| 100.00 | 0 | 1 |
Doing a little more aggregation we get the table below. If a person has no L. Jensenii they have a 8% chance of having Long COVID, If there is any present, the odds increases 13% chance, a higher amount pushes it up to 17% (double the odds).
Conclusion: L. Jensenii probiotics are a definite to be avoided probiotic for Long COVID
| %ile Range | HasTotal | HasNotTotal | Ratio |
| Not Present | 344 | 3852 | 0.08 |
| 0.00 | 1 | 3 | 0.25 |
| 4.21 | 0 | 15 | 0 |
| 20.00 | 2 | 22 | 0.08 |
| Over 20 | 9 | 44 | 0.17 |
| Over All | 12 | 84 | 0.13 |
Danger Will Robinson: Do not over simplify
Looking at another bacteria with P < 0.0001, we see charted below. The bacteria is commonly reported.
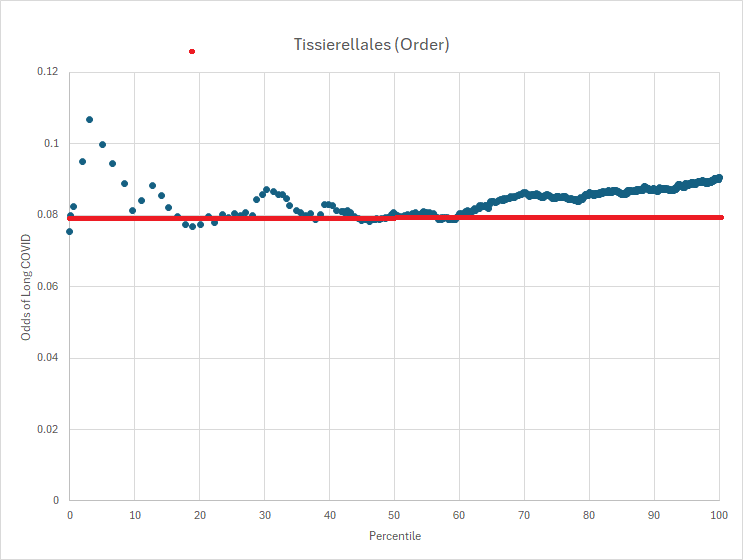
What is evident is that the association is range sensitive, and thus reference ranges:
- Below 17%ile is out of range
- Between 28%ile and 34%ile is out of range
- Over 60% is out of range
Many microbiologists would say that this does not make sense. At this point I should remind people of quorum sensing with bacteria.
Quorum sensing is a communication process that allows bacteria to sense and respond to their population density using chemical signaling molecules called autoinducers. Each bacterium produces and releases autoinducers into its environment. As the population grows, the concentration of these molecules increases. When a threshold level is reached, autoinducers bind to specific receptors, triggering changes in gene expression that coordinate group behaviors such as biofilm formation, virulence factor secretion, sporulation, and bioluminescence.
At this point, many minds may be going into ‘statistical culture shock‘. For me, it makes complete sense and is often seen across nature. They are sometimes termed “islands of stability” in some sciences. In our case “islands of symptoms” would be a more accurate name.
We may end up committed blasphemy against conventional linear mechanic thinking!
Examples:
Alloys With Maximum Strength at Specific Composition
- Iron-Carbon Steel: In carbon steel, maximum strength is usually achieved at a carbon content near 0.8% (known as “eutectoid steel”), where the steel forms a very fine pearlite structure on cooling. Both lower and higher carbon percentages reduce ductility or create brittleness, decreasing usable strength for many applications.
- Aluminum-Copper Alloy (Al-Cu): The precipitation strengthening of aluminum alloys, such as in the Al-Cu system, reaches maximum effectiveness at about 4–5% copper by weight. Below or above this optimal range, strengthening diminishes because either not enough or too much second phase is created.
- Nickel-Iron Alloys: For instance, “Permalloy” (a nickel-iron alloy) typically reaches its desired magnetic properties with about 80% nickel and 20% iron. Changes in this ratio result in reduced magnetic strength, which can be considered a parallel with mechanical strength in many alloys.
Wildlife Systems with Optimal Mixtures
- Animal Diversity in Food Webs: Studies show that increasing the number of animal species generally increases total animal biomass and plant consumption rates, up to a point. Beyond this, higher diversity leads to increased intraguild predation (animals eating each other), which can reduce overall community efficiency and stability.
- Keystone Species: Some ecosystems depend on a particular balance among keystone species and others. Removing or adding too many can severely weaken the system, in analogy to alloys with optimal composition.
- Biodiversity-Function Relationship: The stability and strength of ecosystems typically follow a nonlinear relationship with species richness: there is a “sweet spot” where ecosystem functions (like carbon sequestration or primary production) are maximized.
Nuclear Islands of Stability
- The best-known island is around atomic numbers (Z) 114 to 126 and neutron number (N) 184, where theoretical calculations suggest nuclei could have half-lives of minutes, days, or potentially even years, instead of the microseconds typical for super heavy elements nearby.
Other Physical Sciences
- The term may be used metaphorically to describe stable orbital configurations or regions where system dynamics are less chaotic.
Returning to Long COVID
With Tissierellales we have a complex behavior. With Lactobacillus Jensenii we have a simple “if present, reduce it” finding. I returned to the lists above and attempted to identify those with a simple finding with a P < 0.05 for the odds ratios. This is shown in the table below.
- Reduce Beijerinckiaceae, family, With odds being almost 2x for those with Long COVID, i.e. 0.059 vs 0.026
- Increase Parachlamydiales, order, With odds being more than 10x for not having Long COVID, i.e.
0.067 vs 0.1
Other have the odds being close to each other. For example, Tissierellales (0.978 vs 0.973). In the next post, we will examine more of the complex behavior ones.
| Correction | Tax_name | Tax_rank | Symptom Odds | No Symptom Odds |
| Anaeroplasma | genus | 0.146 | 0.135 | |
| Candidatus Phytoplasma prunorum | species | 0.722 | 0.738 | |
| 16SrX (Apple proliferation group) | species group | 0.722 | 0.735 | |
| Anaeroplasmatales | order | 0.146 | 0.135 | |
| Anaeroplasmataceae | family | 0.146 | 0.135 | |
| Odoribacter laneus | species | 0.494 | 0.506 | |
| Tissierellales | order | 0.978 | 0.973 | |
| 16SrXV (Hibiscus witches’-broom group) | species group | 0.02 | 0.013 | |
| Candidatus Phytoplasma brasiliense | species | 0.02 | 0.014 | |
| Lactobacillus jensenii | species | 0.034 | 0.021 | |
| Odoribacteraceae | family | 0.961 | 0.941 | |
| Increase | Parachlamydiales | order | 0.067 | 0.1 |
| Schlegelella | genus | 0.062 | 0.042 | |
| Syntrophomonas cellicola | species | 0.039 | 0.019 | |
| Reduce | Hoylesella timonensis | species | 0.348 | 0.295 |
| Weissella thailandensis | species | 0.028 | 0.016 | |
| Campylobacteraceae | family | 0.419 | 0.386 | |
| Campylobacter | genus | 0.388 | 0.354 | |
| Haemophilus | genus | 0.775 | 0.745 | |
| Halanaerobiaceae | family | 0.222 | 0.184 | |
| Atopobium minutum | species | 0.042 | 0.027 | |
| Halanaerobium | genus | 0.222 | 0.184 | |
| Prevotella corporis | species | 0.497 | 0.457 | |
| Anaerococcus vaginalis | species | 0.213 | 0.215 | |
| Corynebacterium genitalium | species | 0.031 | 0.019 | |
| Reduce | Moorella group | norank | 0.534 | 0.447 |
| Dysgonomonas capnocytophagoides | species | 0.042 | 0.053 | |
| Reduce | Beijerinckiaceae | family | 0.059 | 0.026 |
| Reduce | Hydrogenophaga | genus | 0.034 | 0.014 |
Summary
This post explains my approach for ranking which bacteria should be targeted for change, primarily using the P value to guide priority. I compared two types of bacteria: one that is rare and one that is common. Rare bacteria are usually omitted from standard analyses because their scarcity makes conventional measures—such as calculating the mean and standard deviation—poor indicators of significance. Overlooking these bacteria is a methodological error, especially when the data skew exceeds 2, making such traditional metrics inappropriate.
It’s important to keep in mind that bacteria engage in quorum sensing, which influences the metabolites they produce and likely affects the symptoms observed. For some bacteria, the difference in their relative abundance between people with and without a particular symptom can be substantial and may be all that is needed for significance.
When I see lab present a patient data with images like below, I roll my eyes! “It looks likes a bell curve, it smells like a bell curve,….”
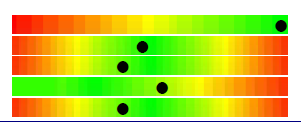
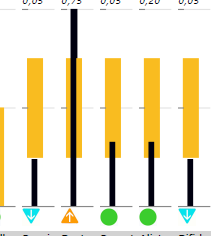
Some reports gives event less information with no ranges and a “normal” — which is computed how? Some choices are below.

- Arithmetic Mean:
The most common type, calculated by summing all the values and dividing by the number of values.
Arithmetic Mean=1n∑i=1nxiArithmetic Mean=n1∑i=1nxi - Geometric Mean:
The nth root of the product of all values, commonly used for ratios or percent changes.
Geometric Mean=∏i=1nxinGeometric Mean=n∏i=1nxi - Harmonic Mean:
The reciprocal of the arithmetic mean of the reciprocals of the data, useful for rates or ratios (e.g., average speed).
Harmonic Mean=n∑i=1n1xiHarmonic Mean=∑i=1nxi1n - Quadratic Mean (Root Mean Square, RMS):
The square root of the average of the squares of the numbers, often used in engineering and physics.
RMS=1n∑i=1nxi2RMS=n1∑i=1nxi2 - Weighted Mean:
The mean where each value has its own (possibly different) weight, calculated as:
Weighted Mean=∑i=1nwixi∑i=1nwiWeighted Mean=∑i=1nwi∑i=1nwixi - Truncated (or Trimmed) Mean:
The mean calculated after removing a specified percentage of the largest and smallest values to reduce the effect of outliers. - Median (sometimes referred to as a kind of mean):
The middle value when the data are sorted. While technically not a “mean,” it is often referenced in the context of central tendency. - Mode:
The most frequently occurring value in the set. Also not a “mean,” but sometimes grouped with measures of central tendency.
Recent Comments