For traditional issues like Helicobacter pylori (H. pylori) , Tuberculosis, Borrelia burgdorferi and Borrelia mayonii, the path to treatment is simple because the goal is to eliminate a single bacteria. When the issue is dysbiosis life become more complex for a variety of reasons. The number of abnormal bacteria reported by a shotgun report could easily exceed 400 and typical monotherapies will help some and hurt others. This is part of a series of Technical Notes on Microbiome Analysis
Microbiome Prescription has an expert system that works off the bacteria selected with a numeric weight on the importance of each bacteria. From this data, an optimal set of suggestions are computed. The number of suggestions often exceeds 1800 different items ranging from using nicotine patches, to diet changes to prescription drugs being used off label. I say optimal from the point of Operations Research (I have an advance degree in that mathematical specialty).
So the question becomes how do you calculate these weight. This is an art with no definitive answer. Below I give some examples of weighing schemes that are possible.
Simple Algorithms
I will give pseudo code for each one to improve clarity. Positive weight indicates too many and thus should be reduced, negative weight indicates too few and thus should be increased. The scale of the weight influences the choices, for example a substance that effects two bacteria: One bacteria is given a weight of +8 and the other of -0.1, the substance will likely be suggested to avoid because it appears to cause more harm (making the high, still higher) than good.
Probiotics only
- 1 when in pathogenic and above reference range
- -1 when in probiotics and below reference range
Naïve High or Low from a set of bacteria
- 1 when in pathogenic and above reference range
- -1 when in commensal and below reference range
Count High or Low from a set of bacteria
- Count – Reference Range High when in pathogenic and above reference range
- – (Reference Range Low – Count) when in commensal and below reference range
Scaled High or Low from a set of bacteria
- Square Root(Count – Reference Range High) when in pathogenic and above reference range
- – Square Root(Reference Range Low – Count) when in commensal and below reference range
Percentile High or Low from a set of bacteria
- Percentile – Reference Range %ile High when in pathogenic and above reference range
- – (Reference Range %ile Low – Percentile) when in commensal and below reference range
Scaled Percentile High or Low from a set of bacteria
- Square(Percentile – Reference Range %ile High) when in pathogenic and above reference range
- – Square(Reference Range %ile Low – Percentile) when in commensal and below reference range
The list of possible formula is endless. For example, the reference range could be Mean +/- N standard Deviations, Box-plot, percentiles (i.e. 5% and 95%ile) and many other ways to determine ranges.
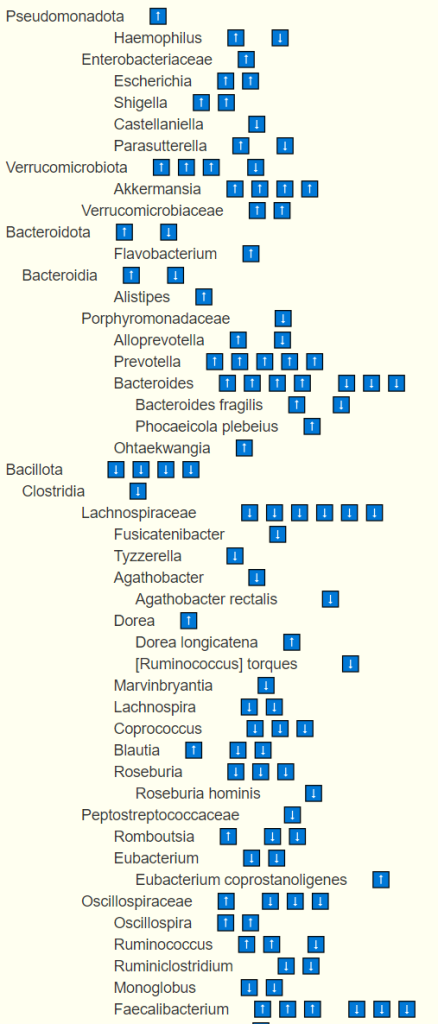
We may also wish to consider bacteria that are not known to be pathogenic, commensal or probiotics. Many bacteria shifts of bacteria for known conditions do NOT fall in these three buckets. For example, on National Library of Medicine Citations for Alzheimer’s disease we see these bacteria

Selecting Algorithm
All of the above are a-priori, “pie in the sky” or ego driven formula. From decades doing data science, I know that you need to test each algorithm over sample data and then see how well the suggestions from the expert system using each algorithm considered compared with published literature. An example is shown in this post, Cross Validation of AI Suggestions for Nonalcoholic Fatty Liver Disease where we got acceptable results:
- To Take: 22 Right to 2 Wrong, i.e. 92% correct
- To Avoid: 10 Right to 2 Wrong i.e. 83% correct
The weighing algorithm selection should never be driven by ego or a priori. It should always be cross validated with a suitable set of samples.
Recent Comments