By Kenneth Lassesen, B.Sc.(Statistics), M.Sc.(Operations Research)
Odds Ratio and Chi2 are two sides of the same coin. The worth of this coin is far more than the fourrées seen with studies using averages.
The simplest case is how often is a specific bacteria reported with the control versus study groups. This is easy computed and can be placed in a table such as the one below
| Control (without Symptom) | Study (or with Symptom) | |
| Bacteria Seen | 300 | 90 |
| Bacteria Not Seen | 600 | 700 |
Just looking at the table, it is obvious that this bacteria is less likely to be seen in a study group. We can just drop these numbers in a page like this one, and get the results.

Converting to odds ratio is simple:
- Compute odds for study group: 90300=3.333.
- Compute odds for control group: 700600≈0.857.
- Odds ratio: that seeing this bacteria put you likely not in the study group
- Or 1/3.89 = 0.257 if seeing this bacteria, places you in the study group
Second Tier: The amount
This is identical to the above, except there is a little mathematics needed to compute the best range of bacteria for odds ratio.
| At 0.04% | Control (without Symptom) | Study (or with Symptom) |
| Above or Equal | 100 | 60 |
| Below | 200 | 30 |
Again a simple computation with great statistical significant.
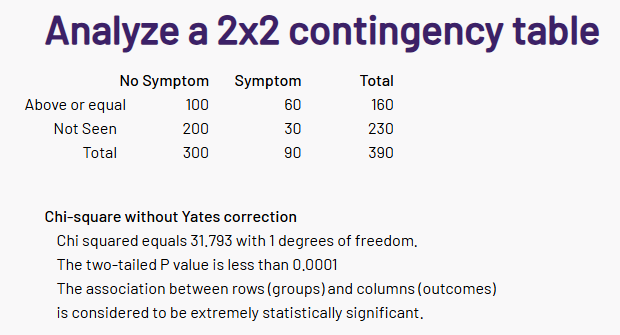
And again the Odds Ratio is calculated the same as above.
- 100/60 = 1.66
- 200/30 = 6.66
- OR = 1.66 / 6.66 = 0.25 (or 4.00 for the reverse.
We have a tri-state odds ratio
- Bacteria not seen: 0.257 of having symptom (i.e. bacteria is rarely seen with symptom)
- Bacteria see but above or equals to 0.04%: 3.89 * 4 =15.56
- Bacteria see but below 0.04%: 3.89 * .25 = 0.9725, almost no effect.
In this example, we used above or below 0.04%; we could have also used in the range (0.03 to 0.07) or not in the range.
Key points
- Use only bacteria with P < 0.001 or better
- Check Present or not Present
- There is a finite enumeration of possible ranges when a bacteria present.
- With today’s powerful computers, this is not a challenge
- Check all bacteria that satisfies the minimum size constraint for the function used for the 2×2 table
For some symptoms we have:
- over 450 bacteria with significant odds ratios for some conditions.
- Highest Odds ratio over 92 for some bacteria
Performance
This data is based on self-declared symptoms from users. Often the symptoms entered are incomplete (some users had over 100 symptoms entered). While not rigorous, this appears to work for getting sample annotations entered in a citizen science context and for demonstration of the concept. There was enough consistency of data to get results.
The best news: The following had the Odds Ratio > 1.0, over a dozen in the sampling and agreement with entered symptoms.
| Source | SymptomName | Accurate % |
| BiomeSight | Official Diagnosis: Mood Disorders | 100 |
| Thryve | DePaul University Fatigue Questionnaire : Frequently get words or numbers in the wrong order | 100 |
| Thryve | Autism: More Repetitive Movements | 100 |
| Thryve | Autonomic Manifestations: cardiac arrhythmias | 100 |
| Thryve | Condition: Acne | 100 |
| Thryve | DePaul University Fatigue Questionnaire : Pain in Multiple Joints without Swelling or Redness | 100 |
| Thryve | DePaul University Fatigue Questionnaire : Feeling like you have a temperature | 100 |
| Thryve | Official Diagnosis: Diabetes Type 1 | 100 |
| Thryve | Neurological: Spatial instability and disorientation | 100 |
| Thryve | Condition: Type 1 Diabetes | 100 |
| Thryve | Neuroendocrine Manifestations: abnormal appetite | 100 |
| BiomeSight | Autonomic Manifestations: delayed postural hypotension | 100 |
| Thryve | Physical: Long term antibiotics(over 6 months) | 100 |
| Thryve | Comorbid: Electromagnetic Sensitivity (EMF) | 100 |
| BiomeSight | Physical: Bad Air Quality | 100 |
| BiomeSight | Neuroendocrine Manifestations: marked diurnal fluctuation | 100 |
| Thryve | Physical: Amalgam fillings | 100 |
| BiomeSight | Comorbid: Reactive Hypoglicemia | 100 |
| Thryve | Comorbid: Sugars cause sleep or cognitive issues | 100 |
| BiomeSight | Official Diagnosis: Dermatitis (all types) | 100 |
| Thryve | Physical: Steps Per Day 2000-4000 | 100 |
| Thryve | Neuroendocrine Manifestations: Painful menstrual periods | 100 |
| Thryve | General: Anhedonia (inability to feel pleasure) | 100 |
| BiomeSight | Virus: Parvovirus positive (B19) | 100 |
| BiomeSight | Blood Type: FUT2 secretor | 100 |
| Thryve | Official Diagnosis: High Blood Pressure (Hypertension) | 100 |
| Thryve | DePaul University Fatigue Questionnaire : Poor hand to eye coodination | 100 |
| Thryve | Infection: Coxsackie | 100 |
| Thryve | Neuroendocrine Manifestations: marked diurnal fluctuation | 100 |
Looking at the biggest sets. we see very good performance for some symptoms and poor performance for items like gender. Unrefreshing Sleep is interesting:
- Unrefreshed sleep: 88.6% accurate
- Unrefreshing Sleep, that is waking up feeling tired: 36.7% accurate
Is the cause, the fineness of definition (and lack of clarity by users entering) or some other issues?
| Source | Symptom | % Correct | Size |
| BiomeSight | General: Fatigue | 98.70317 | 694 |
| BiomeSight | Neurocognitive: Brain Fog | 98.18182 | 660 |
| BiomeSight | Sleep: Unrefreshed sleep | 88.57616 | 604 |
| BiomeSight | Neurocognitive: Difficulty paying attention for a long period of time | 75.54113 | 462 |
| BiomeSight | Immune Manifestations: Bloating | 90.13761 | 436 |
| BiomeSight | DePaul University Fatigue Questionnaire : Fatigue | 85.96491 | 399 |
| BiomeSight | Gender: Male | 59.79644 | 393 |
| BiomeSight | Comorbid: Histamine or Mast Cell issues | 88.0102 | 392 |
| BiomeSight | Official Diagnosis: COVID19 (Long Hauler) | 97.87798 | 377 |
| BiomeSight | DePaul University Fatigue Questionnaire : Unrefreshing Sleep, that is waking up feeling tired | 36.66667 | 360 |
| BiomeSight | Neurocognitive: Can only focus on one thing at a time | 63.76404 | 356 |
| BiomeSight | Neuroendocrine Manifestations: worsening of symptoms with stress. | 70.26239 | 343 |
| BiomeSight | Neurological-Audio: Tinnitus (ringing in ear) | 60.71429 | 336 |
| BiomeSight | Neurocognitive: Problems remembering things | 47.00599 | 334 |
| BiomeSight | Age: 30-40 | 97.14286 | 315 |
| BiomeSight | DePaul University Fatigue Questionnaire : Post-exertional malaise, feeling worse after doing activities that require either physical or mental exertion | 92.33227 | 313 |
| BiomeSight | Neurocognitive: Absent-mindedness or forgetfulness | 62.7907 | 301 |
| BiomeSight | Sleep: Daytime drowsiness | 69.33333 | 300 |
| BiomeSight | Post-exertional malaise: General | 85.95318 | 299 |
| BiomeSight | Immune Manifestations: Constipation | 83.22148 | 298 |
Lab Performance
Identification by Age exhibits the reality of all labs are not equal. If Odds Ratios from the microbiome was not statistically significant for estimating age, we would see 14% for accuracy. We far exceed that.
| Lab | Symptom | Accuracy | Size |
| BiomeSight | Age: 0-10 | 86.2 | 29 |
| Ombre | Age: 0-10 | 76.3 | 59 |
| BiomeSight | Age: 10-20 | 80 | 25 |
| Ombre | Age: 10-20 | 94.7 | 19 |
| BiomeSight | Age: 20-30 | 58.5 | 135 |
| Ombre | Age: 20-30 | 64.7 | 34 |
| BiomeSight | Age: 30-40 | 97.1 | 315 |
| Ombre | Age: 30-40 | 66.3 | 104 |
| BiomeSight | Age: 40-50 | 22.2 | 203 |
| Ombre | Age: 40-50 | 71.4 | 63 |
| BiomeSight | Age: 50-60 | 29.7 | 111 |
| Ombre | Age: 50-60 | 61.7 | 47 |
| BiomeSight | Age: 60-70 | 52.5 | 59 |
| Ombre | Age: 60-70 | 18.1 | 83 |
| BiomeSight | Age: 70-80 | 90 | 20 |
This difference of labs is seen with other symptoms — some of which has associations reported in the literature.
| Source | SymptomName | Ratio | Size |
| BiomeSight | General: Depression | 67.7 | 195 |
| Ombre | General: Depression | 13.9 | 108 |
| BiomeSight | General: Fatigue | 98.7 | 694 |
| Ombre | General: Fatigue | 20.8 | 149 |
| BiomeSight | General: Headaches | 71.6 | 197 |
| Ombre | General: Headaches | 15.5 | 103 |
Summary
The use of odds ratios provides statistically significant evidence for identifying probable symptoms. While not definitive—acknowledging that few diagnostic tests achieve complete certainty—the results demonstrate that both the selected testing method and its interpretation (for example, in relation to bacterial associations) materially influence diagnostic accuracy.
In clinical contexts, reliance on odds ratios offers greater methodological rigor than studies reporting merely “higher or lower levels of certain bacteria with .” A notable clinical strength of this approach lies in its capacity to generate a structured list of potential symptoms for further inquiry, including those that patients may not have initially disclosed.
Nota Bene: It should be noted that the observed error rate is likely attributable, at least in part, to underreporting of symptoms. Patients often disclose only the symptoms they perceive as most severe, thereby introducing reporting bias into the dataset.
The table below shows the accuracy from 4 different labs. It is not a surprise that Shotgun data is more accurate than 16s tests.
| Source | Ratio | Size |
| BiomeSight – 16s | 60.8 | 45069 |
| Thorne – Shotgun | 80.7 | 491 |
| Ombre/Thryve – 16s | 40.8 | 17123 |
| uBiome – 16s | 47.6 | 13071 |
Recent Comments