A reader wrote the following to me. This post and associate video is an attempt to answer.
When I compare my first two analyses from Biomesight under “Multiple Samples,” the distribution of bacteria improves toward normal—assuming that the reduction in “Lab Read Quality” from 39.3 to 23.5 does not mean that the latest sample is a false positive. I have read your article “Lab Quality Versus Bacteria Reported,” but I am too brain fogged to really understand the content.
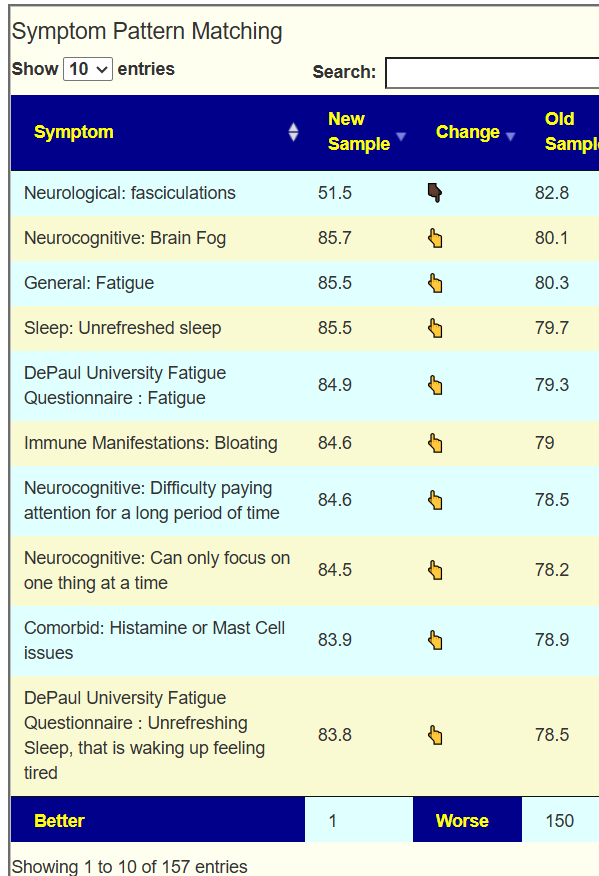
In fact, “Symptom Pattern Matching” states that there was only one improvement and 150 deteriorations. Subjectively, I feel differently, not really better, but not much worse either. That’s why I don’t know how to interpret these results. (Better: nausea, migraine, constipation—Worse: brain fog, fatigue, sleep, muscle strength. So, speculation that: MCAS is improving, but ME-CFS continues to progressively worsen).
The suggestions under “To Avoid” have changed under “Food.” It is interesting to note that, before I was aware of these suggestions, they were already reflected in my appetite or aversion to certain foods; so it is reassuring that my body perception actually corresponds to the measured facts and the statistically supported conclusions.
Unfortunately, my subjective perception of a change, but not an improvement, would then also correspond with the “outside ranges” and “symptom pattern matching.” (Objectively, I measure heart rate variability, pulse, and temperature with a simple GARMIN device and thermometer.)
I don’t know enough about statistics and am not fully mentally present, so I would be grateful if you could provide a few assessments of the measured changes, if you have the time.
Sample Comparison
With two or more samples, the ability to compare samples using symptom forecasts is intended to give a good indicator of change. In most cases, there is significant improvement. In this case, things became worse.
There can be many causes:
- Catching a virus, food poisoning, etc between samples
- Ignoring the “Avoids” – items that feed the bad bacteria
- Trying to follow two sets of advice that have not been reconcilled
- A health consultant and microbiome prescription suggestions.
“Feeling the same” with these minor shifts is not unexpected. Remembering how you were tend to be unreliable; bad memories fail fast.
Getting Suggestions is Easy, Picking Bacteria is not
Microbiome Prescription is constantly update on what influence bacteria from new studies every week. At present if has a 7,432,372 Modifier-to-Bacteria relationships in its database. Given a set of bacteria, their shifts and the relative importance of each bacteria, the suggestions are a relatively simple computation.
Picking Bacteria
If you go to the typical alternative health practitioners, or just ask on line, you may not need to get a microbiome tests. From your symptoms, they will speculate on the issue and give suggestions that they will swear works. In reality, they may appear to work because the patients that they worked for, will come back to see them again. For those where it does not work, they will move on to the next “expert”.
Testing labs will often provide a reference range for some bacteria and thus identify if you have too much or too low. There are many technical issues using these. Personally, I avoid using them — but to make people happy, several are provided on the site (Old UI).

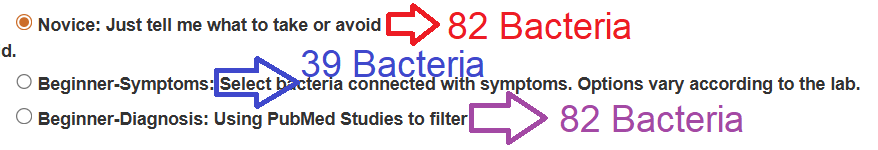
The Simple UI gives a few canned choices for selecting the bacteria and then does the easy part, computing suggestions. The numbers of bacteria vary greatly.
A new algorithm in development, identified 2 very critical bacteria (HIGH WEIGHT) and 20 minor bacteria. The goal of the new algorithm is to better pinpointing the key bacteria and their impact.to look
- Both Samples had the same top item
- Megamonas, genus, weight 109, too high on both tests
- Morganellaceae, famiy, weight 92, too high on latest test only,
The addition of Morganellaceae in the latest sample may account for the worse report.
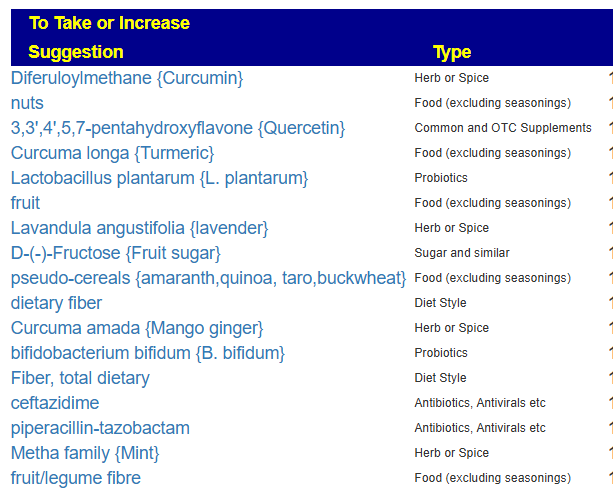
Going forward, I would look at what decreases these two bacteria. I ran your latest data through the suggestion algorithm and attach the full set of suggestions in excel.
The main take items from the new algorithm are below
- Slow digestible carbohydrates. {Low Glycemic}
- dietary fiber
- Fiber, total dietary
- fruit
- fruit/legume fibre
- High-fibre diet {Whole food diet}
- Lactobacillus plantarum {L. plantarum}
- (2->1)-beta-D-fructofuranan {Inulin}
- oligosaccharides {oligosaccharides}
- 5,6-dihydro-9,10-dimethoxybenzo[g]-1,3-benzodioxolo[5,6-a]quinolizinium {Berberine}
- bacillus,lactobacillus,streptococcus,saccharomyces probiotic
- 3,3′,4′,5,7-pentahydroxyflavone {Quercetin}
- fucoidan {Brown Algae Extract}
- Lacticaseibacillus rhamnosus {l. rhamnosus}
- yogurt
- grapes
- polyphenols
- Grape Polyphenols {Grape Flavonoids}
- bacillus
- bifidobacterium longum {B.Longum }
- Linum usitatissimum {Flaxseed}
- resveratrol-pterostilbene x Quercetin {quercetin x resveratrol}
- ß-glucan {Beta-Glucan}
- Saccharomyces cerevisiae var boulardii {S. boulardii}
- Outer Layers of Triticum aestivum {Wheat Bran}
- tea
Compared to the existing using symptoms. They are similar and both have top items of:
- Lactobacillus plantarum
- fruit
- dietary fiber
Recent Comments