Past analyses have explored the prediction of symptoms using odds ratios derived from populations that utilized the same microbiome test and data-processing pipeline. A colleague recently inquired whether percentile-based comparisons could potentially be applied across different microbiome testing platforms.
The core issue, as well documented in the literature, stems from a severe lack of standardization in microbiome data processing (See discussion here). This report presents results derived from all available data encompassing multiple test sources.
An important methodological concern arises from potential double-counting when odds ratios are calculated simultaneously for a strain, its parent species, and its broader taxonomic family. To address this, I apply odds ratios at distinct taxonomic ranks to ensure proper separation of these hierarchies.
A secondary consideration involves the subjective nature of symptom reporting. As symptoms are self-reported, respondents tend to record only the most severe experiences, resulting in an expected underreporting of minor or moderate symptoms. This introduces reporting bias that likely reduces overall agreement levels.
Forecast agreement with Report
The table below provides insight into which taxonomic ranks may be most predictive. It is truncated at a 10% agreement threshold for clarity.
| Rank | Predicted | Agreement | Percentage |
| species subgroup | 126 | 55 | 43.7 |
| subkingdom | 42 | 17 | 40.5 |
| superphylum | 1124 | 379 | 33.7 |
| superfamily | 2187 | 438 | 20.0 |
| infraclass | 669 | 126 | 18.8 |
| cohort | 692 | 130 | 18.8 |
| superorder | 1034 | 193 | 18.7 |
| suborder | 18539 | 3147 | 17.0 |
| subphylum | 8339 | 1373 | 16.5 |
| subfamily | 5424 | 834 | 15.4 |
| kingdom | 19385 | 2779 | 14.3 |
| strain | 28091 | 3855 | 13.7 |
| subspecies | 49169 | 6714 | 13.7 |
| species group | 149291 | 17646 | 11.8 |
| superkingdom | 114214 | 12513 | 11.0 |
Reported with Forecast Odds < 1.0
Looking at symptoms reported where the odds was less than 1.0 (i.e. not elevated odds), we have a much shorter table. Looking at some ranks we see that we have around a 2:1 ratio between the tables, i.e. 66% (2/3)
| species subgroup | 30 | 7 | 23.3 |
| superphylum | 1782 | 311 | 17.5 |
| subkingdom | 22 | 3 | 13.6 |
| suborder | 14242 | 1707 | 12.0 |
| subphylum | 7540 | 872 | 11.6 |
| infraclass | 787 | 85 | 10.8 |
Clinical Implications
A More Effective Intake Process
Using forecast results as an interview checklist for clinicians could significantly improve patient assessment. Early data suggest that approximately two-thirds of the checklist items will correspond to reported symptoms. Directly asking patients about specific symptoms is typically more reliable than relying on spontaneous disclosure, as individuals tend to report only their most severe issues.
Improved Identification of Symptom-Associated Bacteria
When a patient confirms the presence of a symptom, this information can be leveraged to identify bacterial taxa most likely contributing to it. This approach contrasts with the traditional method of labeling deviations greater than two standard deviations from the mean as problematic. Instead, it establishes distinct, data-driven thresholds, which sometimes produce counterintuitive but statistically supported findings.
| SymptomName | Tax_Name | Critical Percentile | Odds Ratio |
| Comorbid: Histamine or Mast Cell issues | Cystobacterineae | 46.4 | 0.04 |
| Comorbid: Histamine or Mast Cell issues | Actinomycineae | 58 | 3.46 |
| Comorbid: Histamine or Mast Cell issues | Nannocystineae | 22.4 | 0.1 |
| Sleep: Waking up early in the morning (e.g. 3 AM) | Cystobacterineae | 54.2 | 5.33 |
| Sleep: Waking up early in the morning (e.g. 3 AM) | Nannocystineae | 22.4 | 0.13 |
| Sleep: Waking up early in the morning (e.g. 3 AM) | Coriobacterineae | 65.3 | 0.32 |
| Post-exertional malaise: Next-day soreness after everyday activities | Sternorrhyncha | 31.9 | 0.11 |
| Post-exertional malaise: Next-day soreness after everyday activities | Cystobacterineae | 10.6 | 8.49 |
| Post-exertional malaise: Next-day soreness after everyday activities | Nannocystineae | 16.7 | 0.18 |
For example, in cases of post-exertional malaise (next-day soreness following ordinary activities):
- Individuals above the 31st percentile for Sternorrhyncha have an 18% reduction in odds.
- Those above the 16th percentile for Cystobacterineae experience an 849% increase in odds.
- Individuals above the 16th percentile for Nannocystineae show an 11% reduction in odds.
These relationships indicate that increasing two bacterial groups (if their abundances are below threshold) and decreasing one (if above threshold) could normalize the microbiome toward a healthier state. For the other two conditions presented, the decision points cluster near the median rather than at the extremes, reinforcing that not all microbial influences occur at outlier levels.
Implications for Generating Therapeutic Suggestions
To refine microbial intervention strategies, I employ the Monte Carlo method. In essence, multiple algorithms independently select bacterial targets and propose compensatory actions. The aggregate of these independent results identifies interventions with high consensus and robustness.
Furthermore, using different taxonomic ranks yields multiple independent bacterial subsets—ideal for Monte Carlo modeling—providing a more reliable foundation for therapeutic recommendation generation.
Caveat: The best odds-ratios are based by the same microbiome processing that is used for odds ratio. The intent of this was to see if reasonable results may be obtain at a generic level. IMHO, the answer is yes.
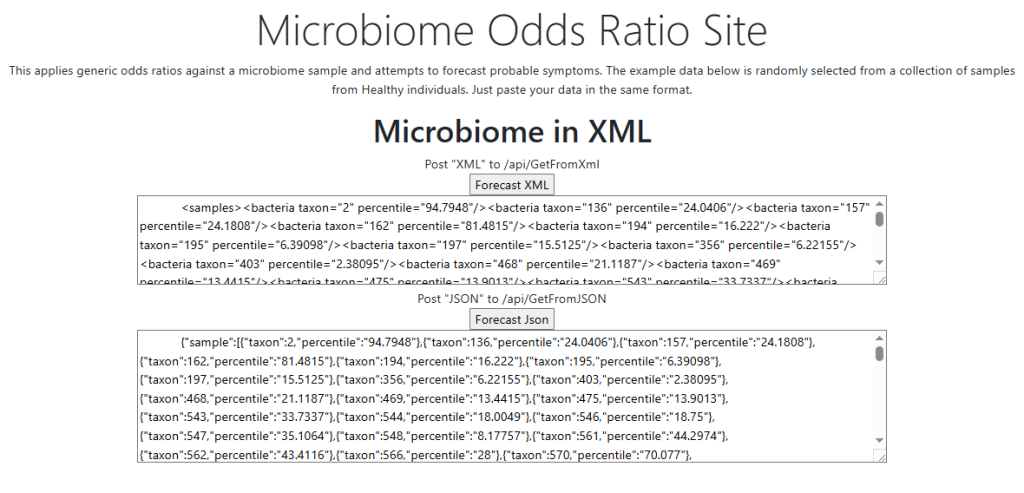
Try it yourself
I have exposed the data on this page. Just paste (or call by API) your data in the format shown. No charge. No limit on use of this Api.
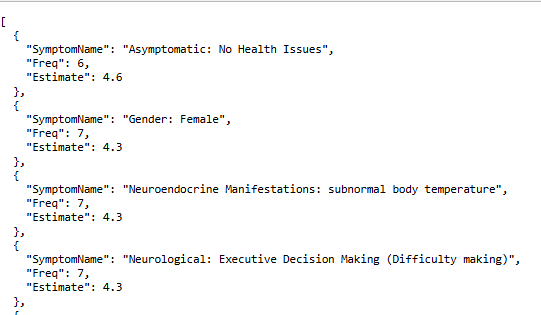
The samples used for illustrations are obtained randomly from samples from a different lab (no data from this lab was used to compute the odds ratios) that are from “healthy individuals”. These samples tend to have the top symptom being “Asymptomatic: No Health Issues” which is consistent with the claim of “healthy individuals”.
- Freq: Is the number of taxonomic ranks that predicted this symptom
- Estimate: Indicates the magnitude of the prediction.
Email me at Research@MicrobiomePrescription.com with comments and opinions.
Recent Comments