The reader with Multiple Chemistry Sensitivity(MCS) also has a diagnosed Mast Cell Activation Syndrome (MCAS). We will add this anchorite request. On the symptom list, I will be using a more generic :
- Comorbid: Histamine or Mast Cell issues
The two earlier posts are here:
Not as Expected
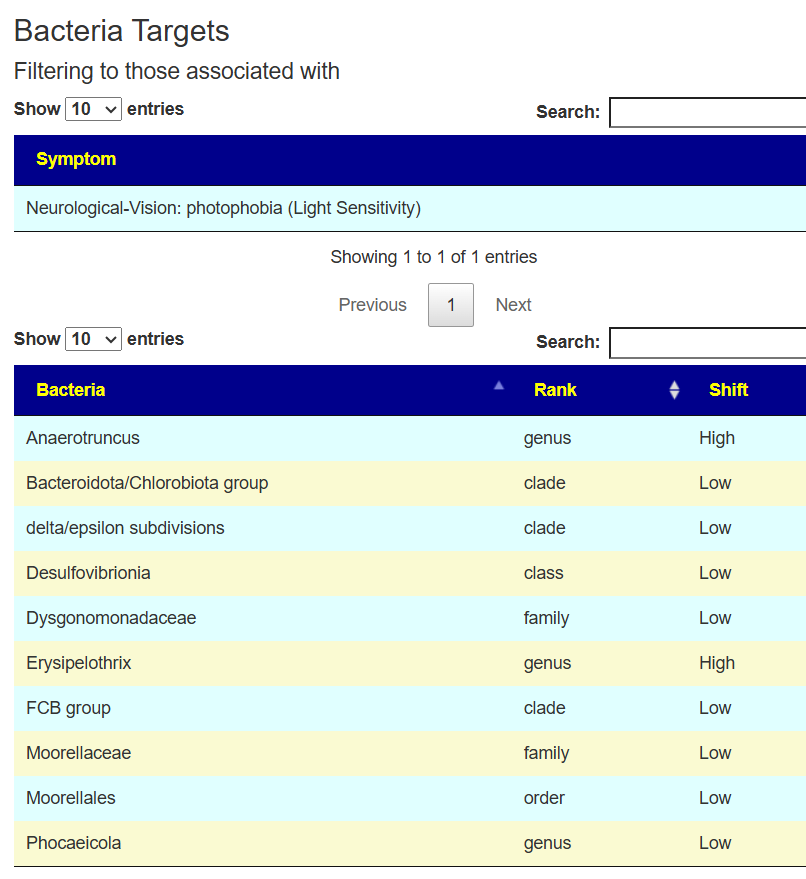
After seeing results, I said to myself “This is NOT what I was expecting”. The first thing that I noted was that the number of significant bacteria was at 98%ile, i.e. 98 of 100 symptoms have less significant bacteria. There are a lot of bacteria that are statistically associated with this symptom!
What are we dealing with
Mast Cell Activation Syndrome (MCAS) is thought to stem from abnormally sensitive or dysregulated mast cells that release mediators too easily, often in response to everyday triggers, with genetics, immune dysregulation, and environmental factors all suspected contributors [2024]
My KISS model for symptoms that are statistically significant is that the metabolites (chemicals) released into the body have become unbalanced because the bacteria in the microbiome has become unbalanced. There are several thousands possible metabolites and we lack any in depth studies for the mixtures seen with MCAS.
Existing Common Treatments
All of these are reducing symptom severity and not curing the cause.
- Histamine blockade (H1 + H2 antihistamines)
- Mast‑cell stabilizers
- Targeted add‑ons (often leukotriene blockers or biologics) plus trigger control
- Leukotriene receptor antagonists (e.g., montelukast) are commonly used to dampen mediator‑driven inflammation, especially in respiratory or systemic symptoms.
- In more refractory or IgE‑linked cases, omalizumab (Xolair) is increasingly used off‑label and has helped some patients by reducing IgE‑mediated activation.
- Systematic trigger identification and avoidance (food, temperature, chemicals, stress) is considered a core part of effective management in all major reviews.
Digging into our data
I am going to skip the explorations that I did in the earlier posts. As with prior post, Odds Ratio has better fine level identification. We also see a lot more bacteria are identified than with the prior two. There are several thousands possible metabolites and we lack any in depth studies for the mixtures seen with MCAS.
| Classic | Odds Ratio | |
| Bacteria Considered | 213 | 298 |
| Bacteria In Common | 52 | 52 |
| Species | 20 | 108 |
| Genus | 33 | 76 |
| Family | 54 | 46 |
| Order | 36 | 34 |
| Class | 23 | 16 |
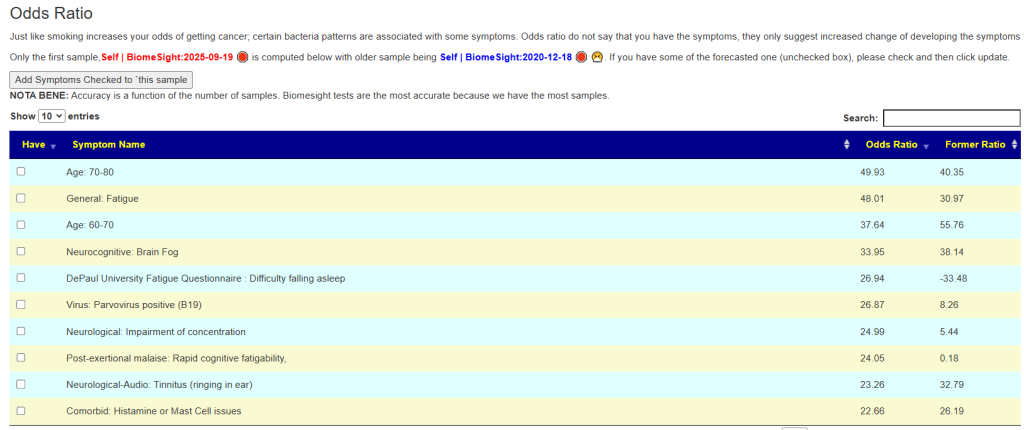
What about MCAS occurring with other symptoms? I just put a page up on the odds. Multiple Chemical Sensitivity is reported just 18% of the time, and light sensitivity at 37% of the time. There is not a strong association.
I did a comparison of the net Log(odd ratio) between people. A person without these issues is expected to have a Log(Odds Ratio) < 0. This Post Person reports moderate light sensitivity.
| Person | Light Sensitivity | MCS | MCAS |
| Last Post Person | 11.8 | 17.3 | 26.1 |
| Anchorite | 5.7 | 16.4 | 13.8 |
Odds based Suggestions are now available
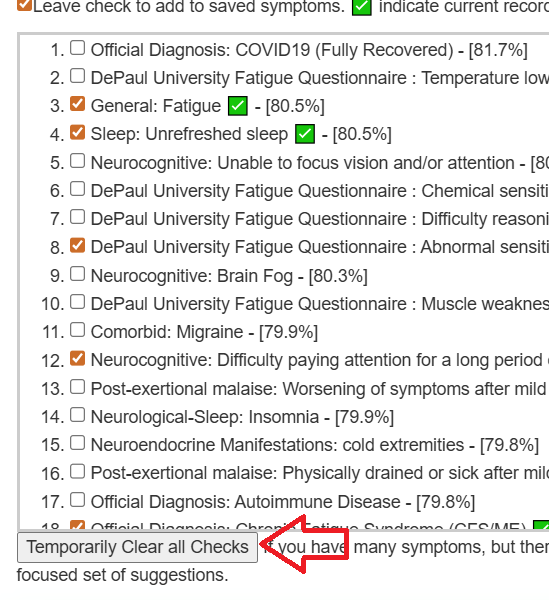
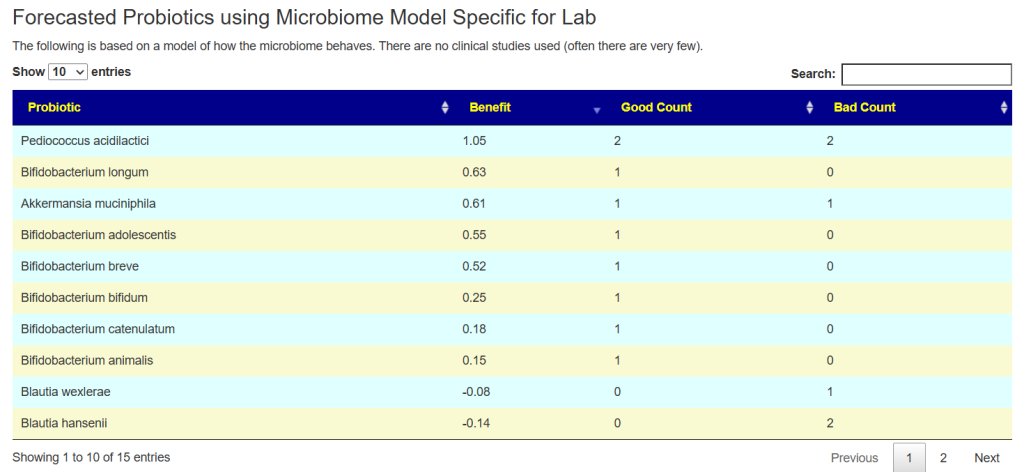
See this video on how to do it. The following suggestions were computed for the Anchorite. There were 24 bacteria deemed significant with Biomesight data, with the top high one being Mycobacterium
Probiotics to take and avoid
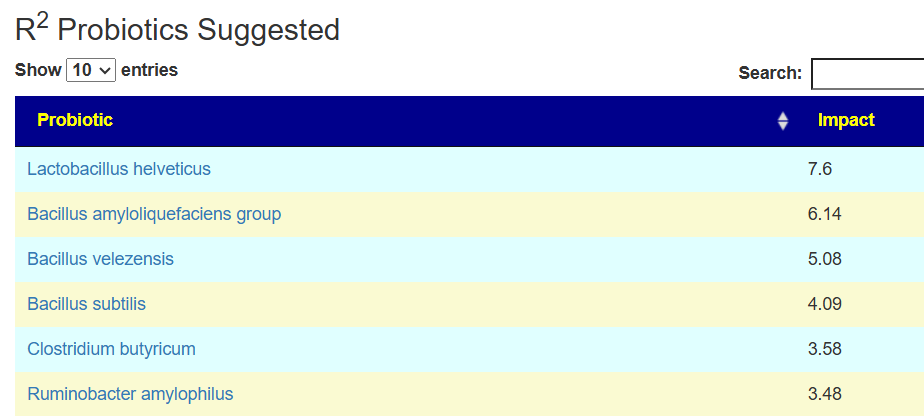
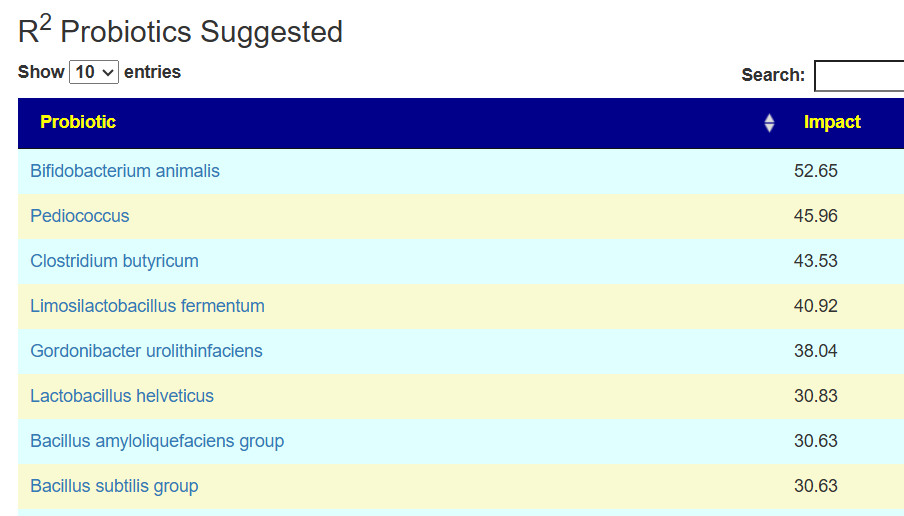
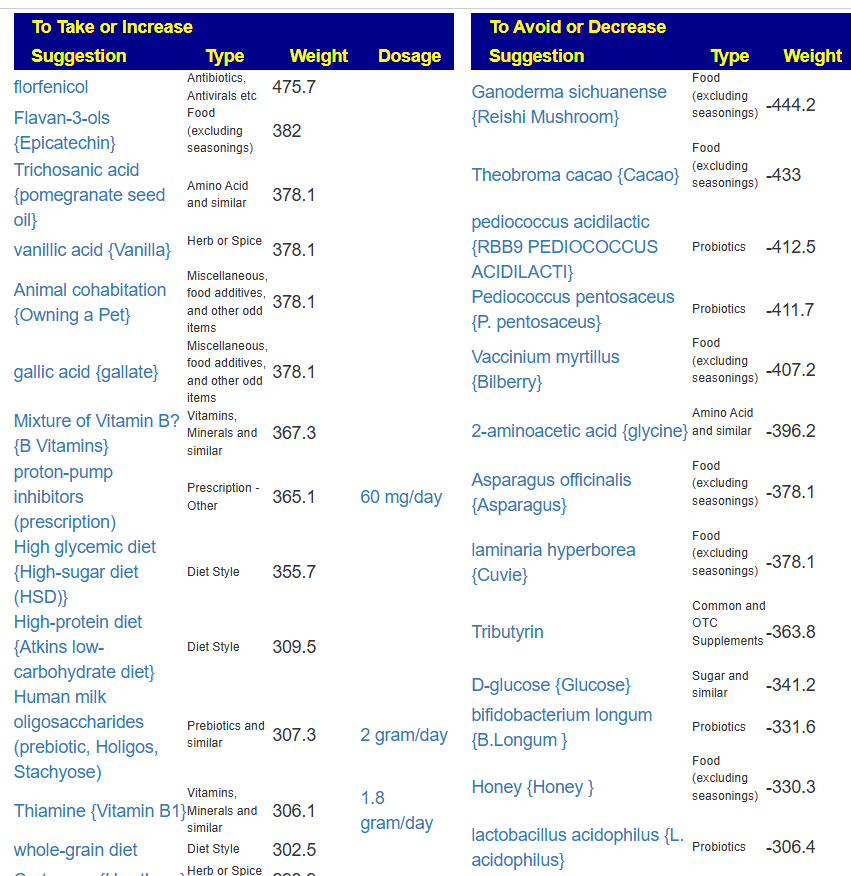
There are no really outstanding recommendations, but three are available and likely worth an experiment.
- Lactobacillus helveticus – this keeps appearing on multiple samples…..
- Bacillus subtilis
- Clostridium butyricum
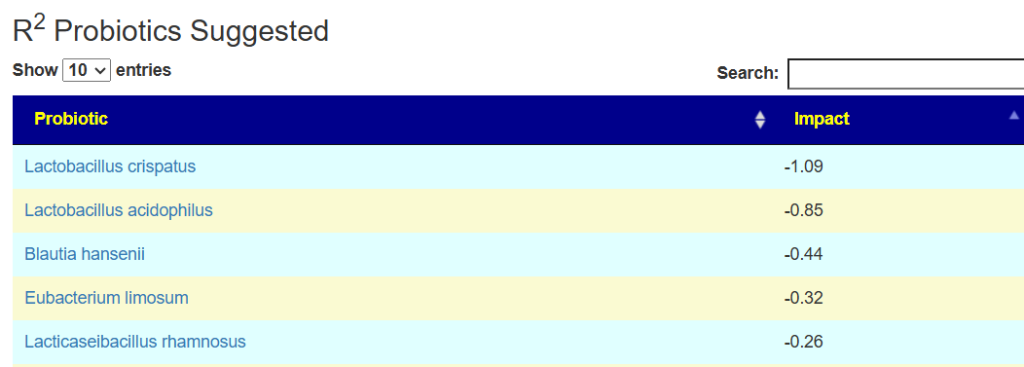
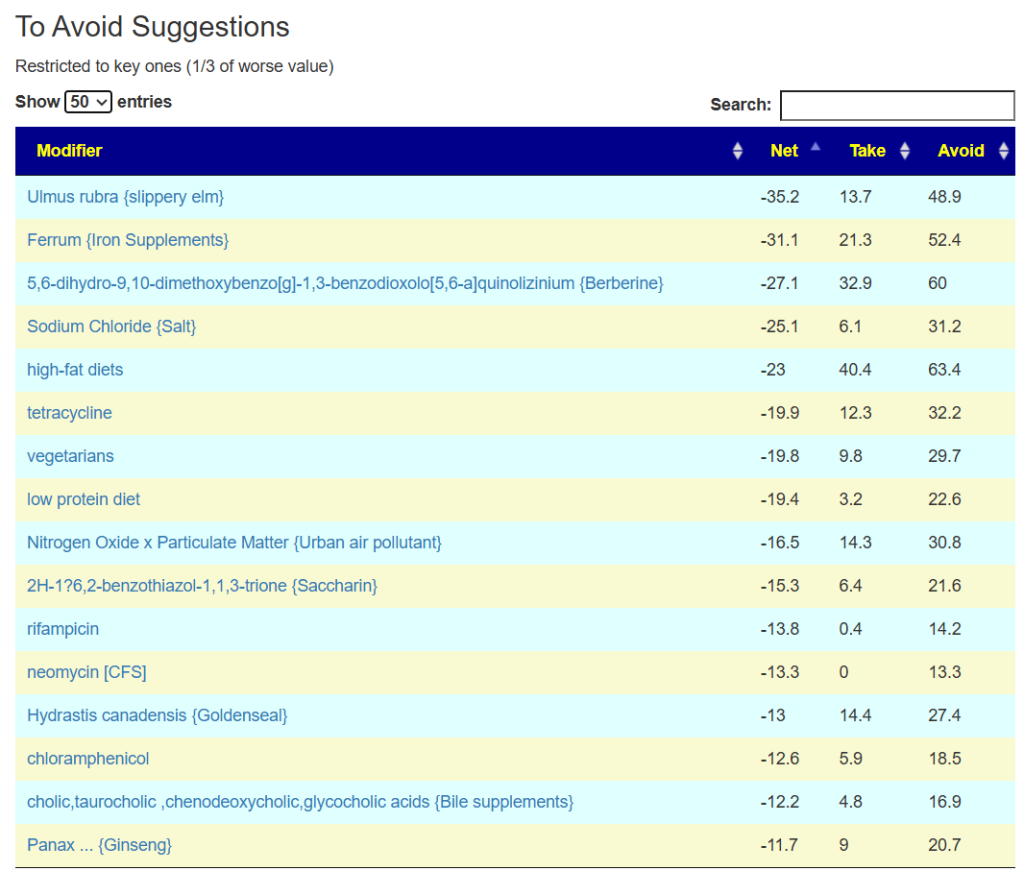
And the to-avoid list. Lactobacillus acidophilus implies that yogurt should be avoided.
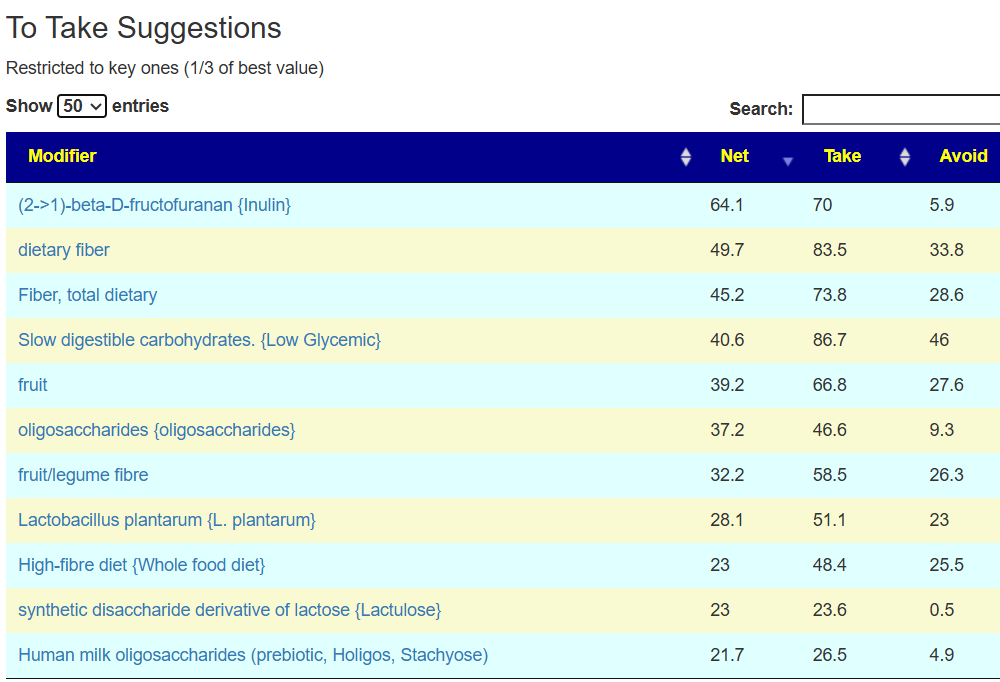
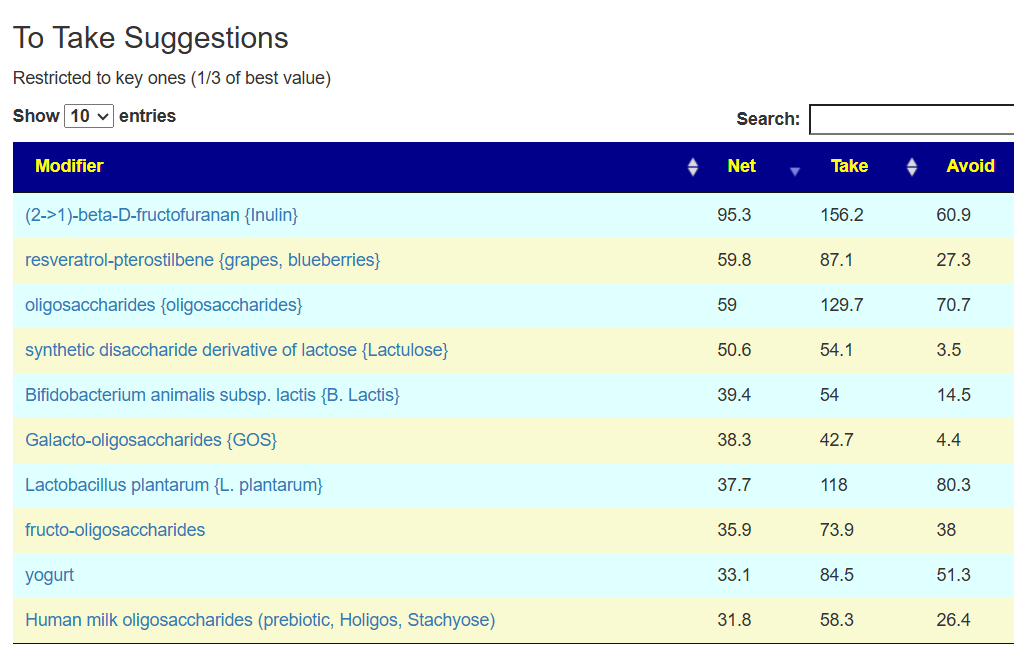
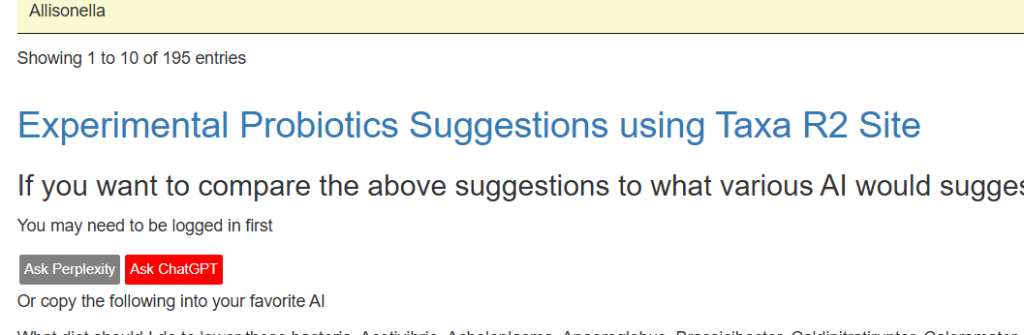
The suggestions are based on studies from the US National Library of Medicine (PubMed). First, I should point out that Lactobacillus plantarum {L. plantarum} is not in the R2 list because there was not sufficient impact computed. PubMed data is less precise for multiple reasons.
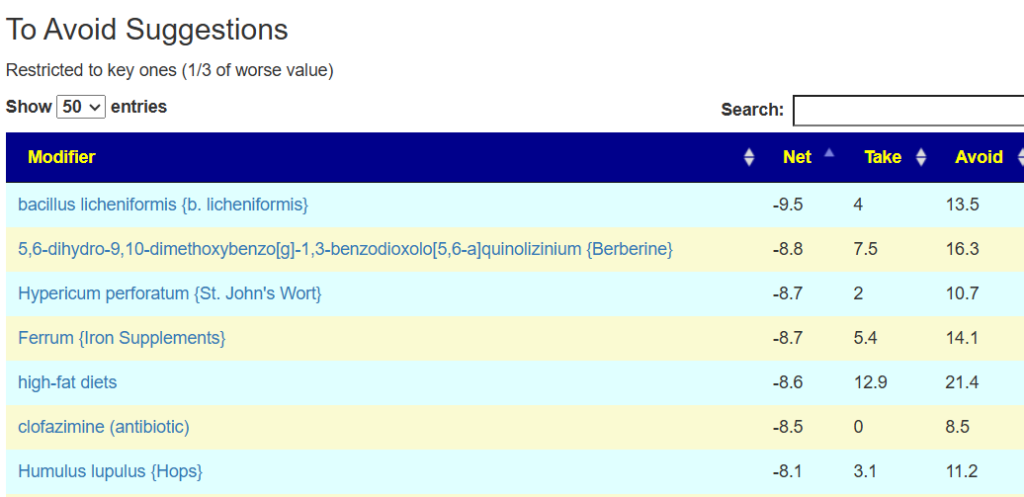
The avoid list is almost 4x longer. I noticed that a lot of herbs and spices are listed as avoid.
Second Opinion using Ombre
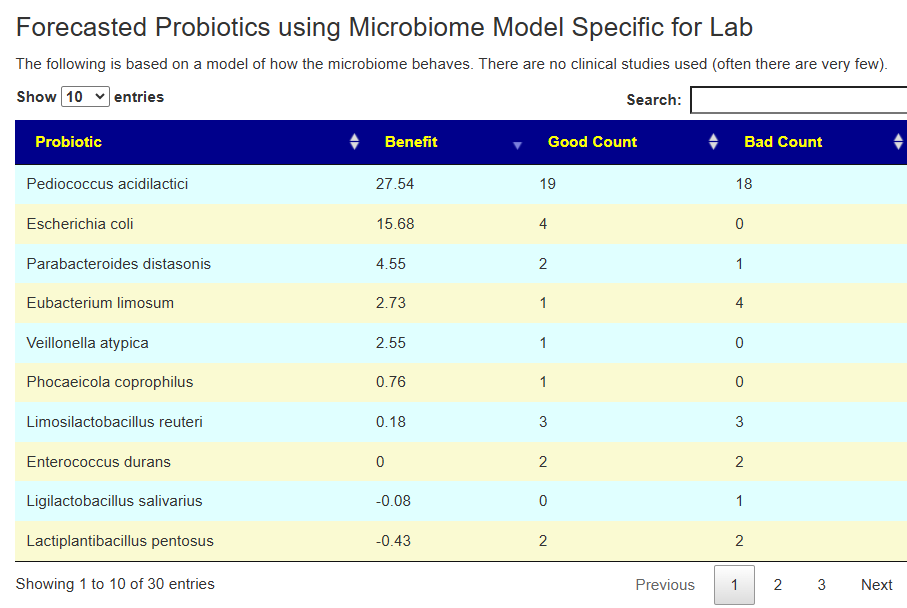
The person had done testing with Ombre, then uploaded their FastQ files to Biomesight — so we have two different reports on the bacteria and the amounts. We also have two different sets of Odds Ratio — each is based on a specific testing lab. 101 bacteria were deemed significant with three being especially too high:
- Lacrimispora sphenoides
- Paucilactobacillus vaccinostercus
- Oribacterium parvum
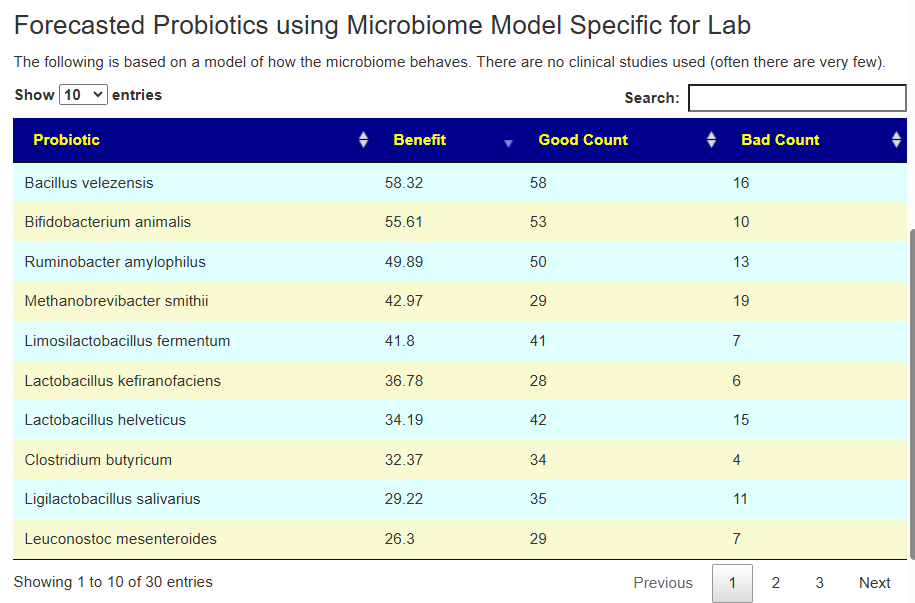
In this case, we had much stronger probiotic recommendations. Lactobacillus helveticus and Bacillus subtilis probiotics occurs on both.
We have similarity with to take suggestions. None of the probiotics suggested were on the above list; this is not unexpected because we are using data from the US National Library of Medicine (PubMed) that is a lot less precise and more fuzzy.
As always, when there is disagreement – go with items that there is agreement with.
The to avoid list is shorter here.
Summary
I discussed some of these finding with folks at PrecisionBiome.Eu and they pointed out that herbs are often avoided because of the belief that they contain histamines. An alternative explanation is that they shift the microbiome; in some cases, they may promote sudden cell death with a release of metabolites into the system (i.e. see Jarisch–Herxheimer reaction).
Why herbs are tricky in MCAS
- MCAS mast cells are hypersensitive, and many different chemicals, including plant constituents, can trigger degranulation, especially in multi‑ingredient herbal mixes.
- Case experience and MCAS guidance note that herbal and “natural” supplements can provoke flares (e.g., some antimicrobial herbs, moringa with high oxalates, concentrated essential oils), so they should be approached like medications, not “automatically safe” foods.
The algorithm that computed suggestions about things to avoid knows nothing about histamines. The calculations are done solely on the bacteria increases and decreases they cause.
This cause the following interpretation speculation of these results:
- The likely cause is not enough of good bacteria to keep the bad ones in balance/control
- The key word is “balance”
- Unless a herb or spice is a strong recommendation, avoid them as much as is practical. There is the appearance that they contribute to inbalance.
- The same may be said of antibiotics
- Probiotics are unlikely to be a “cure all” with low benefit for most and adverse effects with others
Last item, remember the Microbiome Prescription suggestions are best efforts given the lack of standardization of microbiome tests reporting your results, the lack of standardization of microbiome tests used in published studies, etc. It is a fuzzy logic expert system.
If you have multiple samples, compute suggestions for each one and look for commonality. MCAS is a long duration symptom that persists across multiple samples. Increase your odds by looking for consensus in the To Take, and also aggregate the to avoid into a master list of avoids.

Recent Comments