I recently finished building out a new symptom forecasting algorithm. The ultimate goal is not to forecast symptoms, but to identify the bacteria associated to symptoms and a numeric value that each bacteria contributes.
The results are shown below. Honestly, they far exceeded my expectation of 70-85% accuracy. Odds Ratio required P < 0.01 to be included. All of the input data used is available for download.
| Retail Test | Results |
| Biomesight | Forecast Symptom and Declared Symptom agrees: 43,085 Declared Symptom failed forecast ( Odds Ratio < 1): 646 Percentage Accuracy: 98.5% Total Samples: 4,436 Symptoms Evaluated: 363 |
| Ombre | Forecast Symptom and Declared Symptom agrees: 17,492 Declared Symptom failed forecast ( Odds Ratio < 1): 63 Percentage Accuracy: 99.996% Total Samples: 1,319 Symptoms Evaluated: 302 |
| uBiome | Forecast Symptom and Declared Symptom agrees: 11,856 Declared Symptom failed forecast ( Odds Ratio < 1): 26 Percentage Accuracy: 99.998% Total Samples: 791 Symptoms Evaluated: 202 |
| Thorne | Forecast Symptom and Declared Symptom agrees: 1,643 Declared Symptom failed forecast ( Odds Ratio < 1): 11 Percentage Accuracy: 99.99% Total Samples: 253 Symptoms Evaluated: 23 |
This was obtained using Odds Ratio and accepting the complexities of the microbiome. A simple example is the assumption of using the average to determine if too high or low. This is wrong in so many ways, especially give the high skewness seen in the microbiome.
There is no one threshold suits all
To assume a single value applies to all symptoms is naive ideological thinking. You can do it with a significant drop in forecast accuracy (I’ve tried it). The following charts illustrate the patterns discovered.
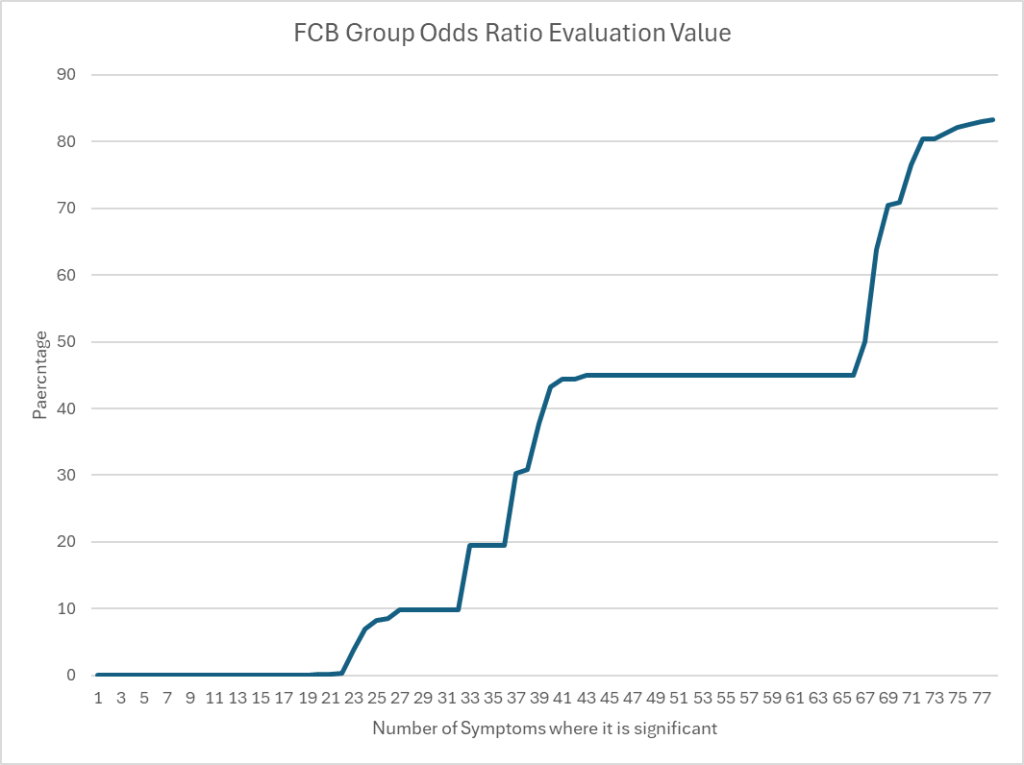
FCB group for Ombre Data
The chart below illustrate that the best threshold for Odds Ratio vary greatly by symptom with about 45% being the most common one. The average over all samples is 30.8%.
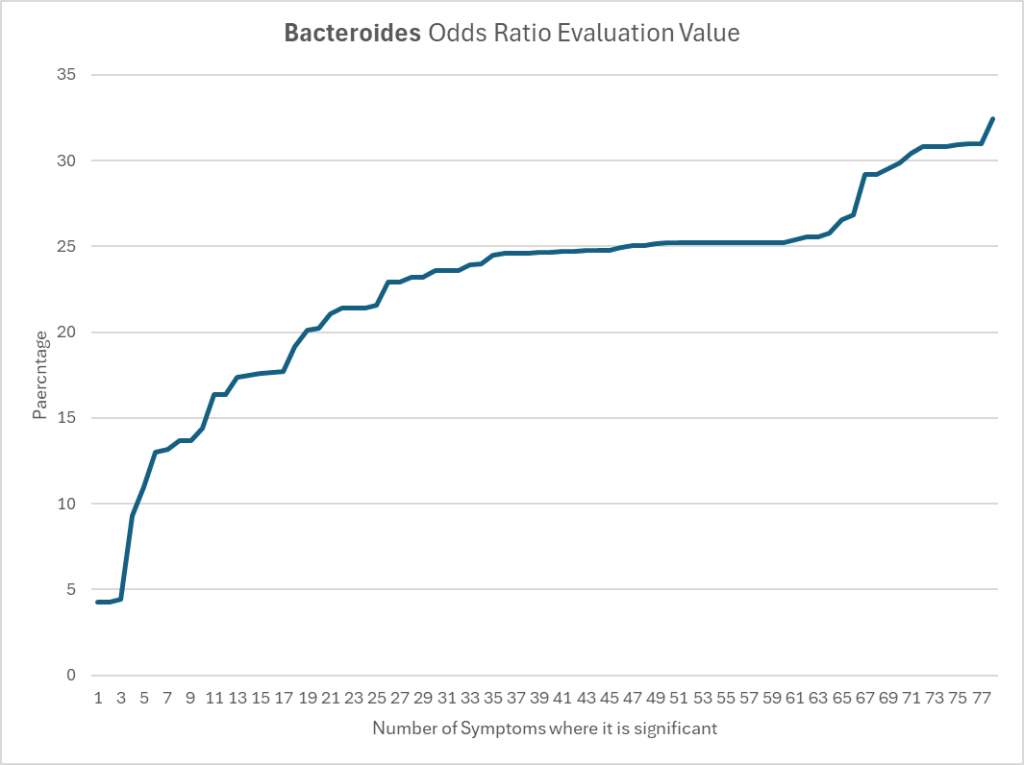
Bacteroides for Biomesight
We see the same behavior elsewhere, with the average 26%.
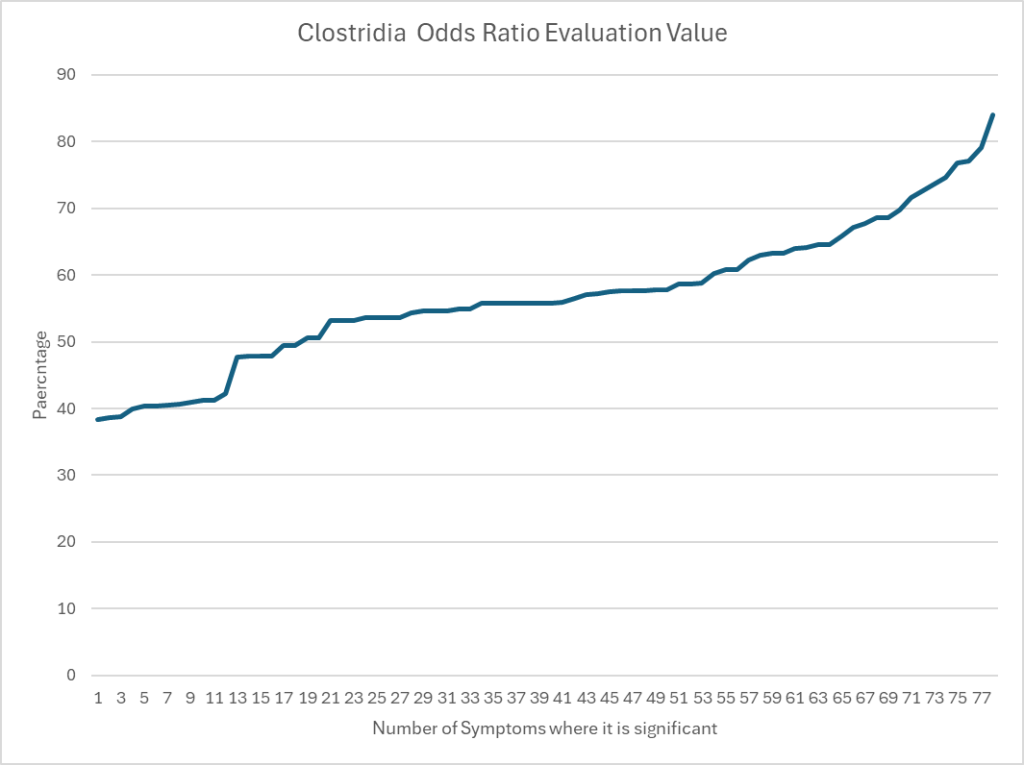
Clostridia for uBiome
Similar to above with an average of 61.4%
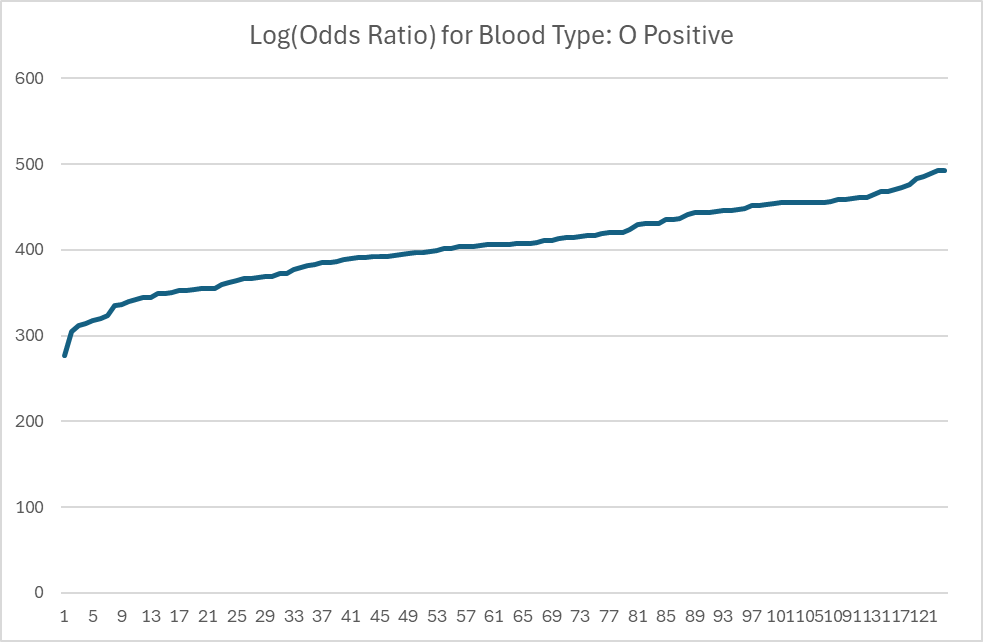
What do the resulting Odds Ratios look like?
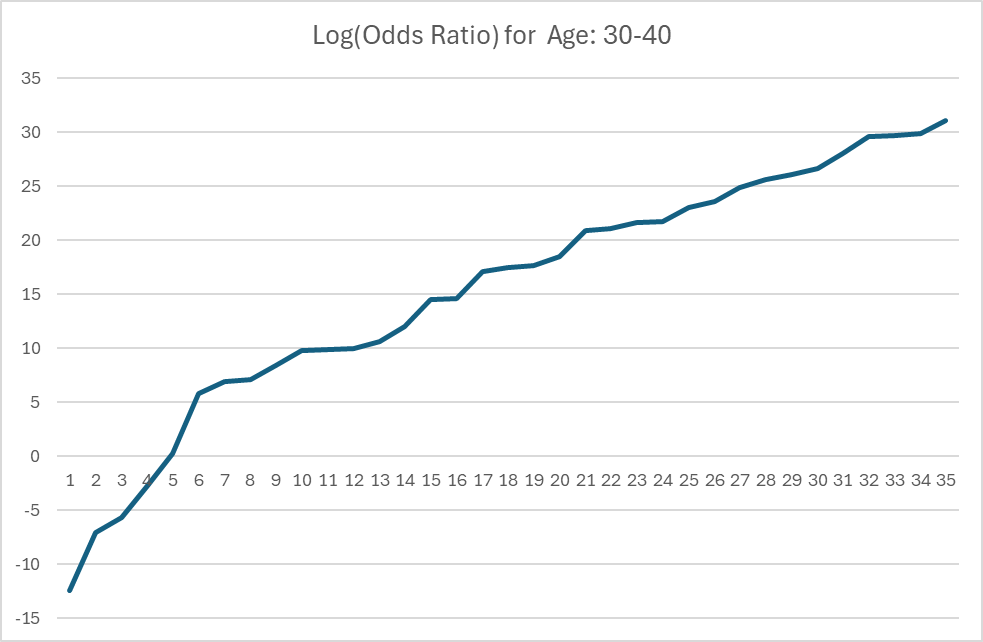
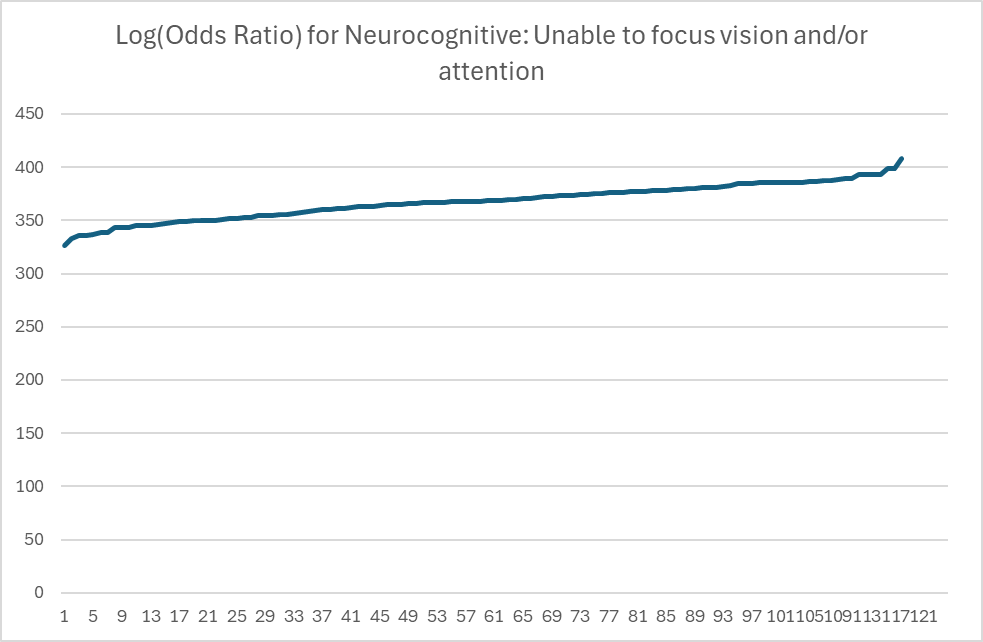
The charts below are for Ombre Data Sets. The numbers are log(Odds Ratio) with the actual odds being pretty high (for an understatement).
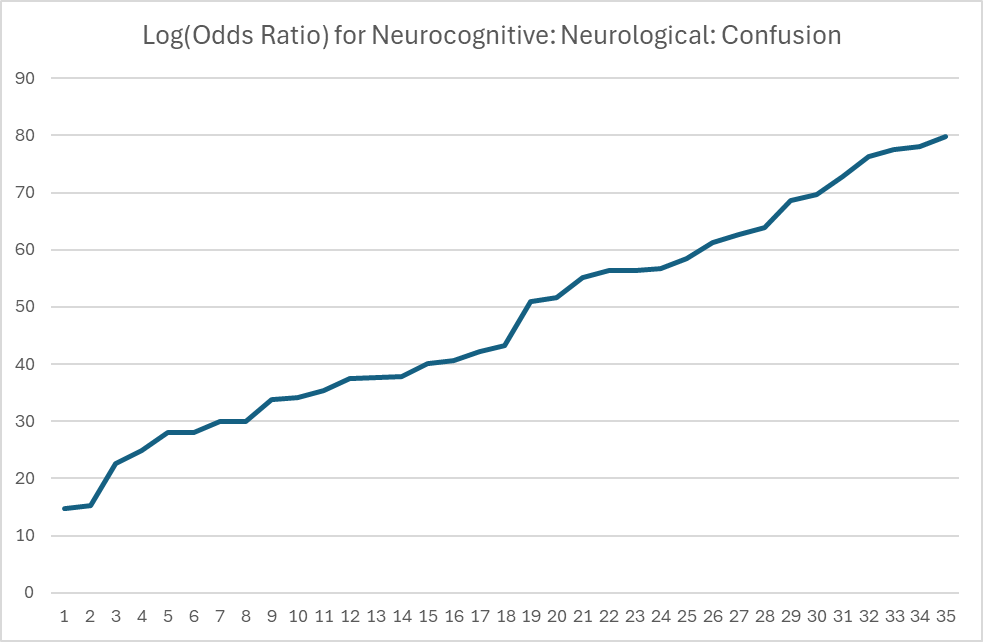

The next chart includes the failure to forecast ones. With the typical Odds Ratio being much lower than others shown, this weakness in prediction is not unexpected. It illustrates that Odds Ratios are indeed Odds.
Most Frequent Bacteria Used for Odds Ratio
It is interesting to note that Lactobacillus is not a top bacteria (despite its popularity with some). Lactobacillaceae shows up as #91, Lactobacillales as #127, Individual Lactobacillus start around #151
| Tax name | Rank |
| Bifidobacterium | genus |
| Bifidobacteriales | order |
| Bifidobacteriaceae | family |
| Actinomycetota | phylum |
| Actinomycetes | class |
| Sutterella stercoricanis | species |
| Listeriaceae | family |
| Caloramator fervidus | species |
| Devosiaceae | family |
| Marvinbryantia | genus |
| Oscillibacter valericigenes | species |
| Devosia | genus |
| Oscillospiraceae | family |
| Bacteroides | genus |
| Bacteroides cellulosilyticus | species |
| Bacteroides uniformis | species |
| Anaerotruncus colihominis | species |
| Coriobacteriaceae | family |
| Anaerotruncus | genus |
| Faecalibacterium | genus |
| Lachnobacterium | genus |
| Paraprevotella xylaniphila | species |
| Mycoplasmatota | phylum |
| Campylobacter ureolyticus | species |
| Mollicutes | class |
| Bacteroidaceae | family |
| Holdemania massiliensis | species |
| Metamycoplasmataceae | family |
| Desulfitobacteriaceae | family |
| Ruminococcaceae | family |
Bifidobacterium for Biomesight
Average is 0.93 which presents a stark contrast to the numbers below.
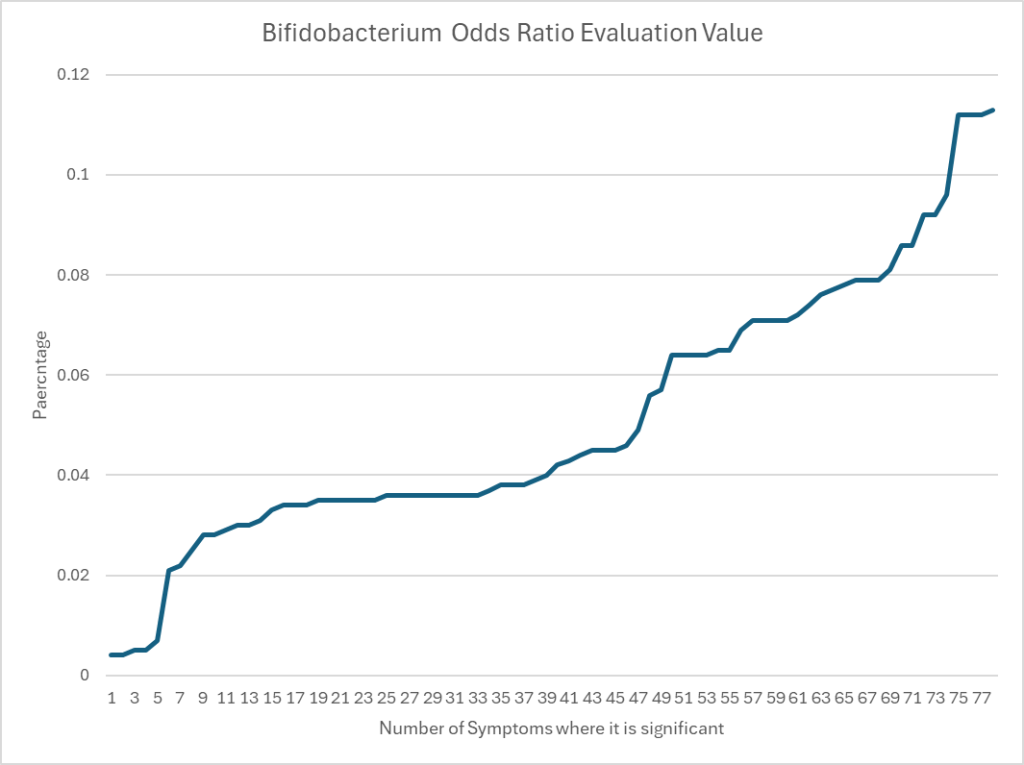
Odds Ratio show significant increased risk for most symptoms with low Bifidobacterium,
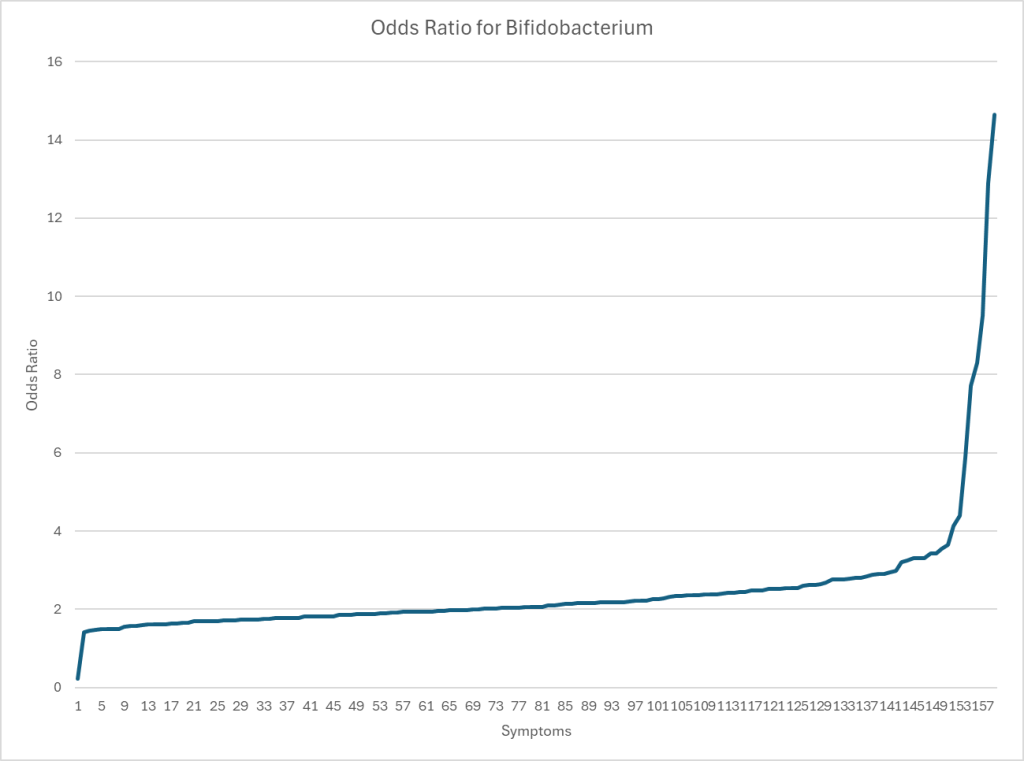
| Symptom | Odds Ratio with low amount |
| Immune Manifestations: Hyperphagia (abnormally hunger or desire to eat) | 14.65 |
| Comorbid: Reactive Hypoglicemia | 12.89 |
| Comorbid: Panic Attacks | 9.51 |
| Neurological: Neuropathy | 7.72 |
| Lactose intolerance | 5.88 |
| Neuroendocrine: Sweating hands | 4.4 |
| Comorbid: Constipation and Explosions (not diarrohea) | 4.14 |
Summary
Odds ratios are designed to have predictive power. An optimized algorithm using odds ratios appear to have awesome power. The challenges with Odds Ratio are simple:
- Having sufficient data to obtain P < 0.01 (or better still, P <0.0001) Odds Ratio
- Addressing each bacteria-symptom individually and not going into simplistic one bacteria level fits all.
- Computational requirements: After a lot of performance tuning, my computations took over 12 hours on a well equipped Microsoft SQL Server machine with 64 GB of memory. Other tech stacks may take considerably longer, a few (like Multithreaded C++) may be a lot of faster.
I deem my success to doing the above being two factors: A M.Sc. in Operations Research where optimization techniques rules, plus extensive experience with SQL Server Performance (including writing multiple white papers for Microsoft). Last, is not following current normative beliefs on how to approach this issue, I follow the numbers (i.e. statistics).
As a historic note, building out this model caused flash backs to programming in Simula and other modelling languages back in the early 1980’s. There is a “zen” for modelling.