In working with Microbiome Prescription, I experimented with various prediction approaches before settling on a workaround that, in many cases, could successfully predict the top 10 symptoms for new microbiome samples, with individuals confirming about 80% of them as accurate reflections of their own symptoms. Though this solution was adequate for practical needs, it was admittedly less than ideal in theory. Recently, I recognized that a more robust and principled prediction algorithm is achievable. The aim of this post is to walk through that process, making it accessible for anyone interested in trying this more rigorous approach.
Accurate prediction identifies the key bacteria that should be altered with statistical justification.
An odds ratio (OR) is a measure of association that describes the odds of a disease, symptom, or event occurring in one group compared to another, often used in medical and epidemiological studies to estimate the strength of risk factors or the effectiveness of interventions.
Understanding Odds Ratios
- The odds ratio is calculated by dividing the odds of the event in the exposed group by the odds in the non-exposed group.
- OR > 1 indicates higher odds of disease with the exposure or risk factor; OR < 1 indicates reduced odds; OR = 1 means no difference in odds between groups.
- Odds ratios are especially used in case-control studies, but also in cohort and cross-sectional studies, and they can approximate risk ratios when the disease or symptom is rare.
Using Multiple Odds Ratios in Disease Analysis
When you have several odds ratios related to a disease, there are several key uses:
- Compare the magnitude of different risk factors: By looking at the odds ratios for various exposures (e.g., smoking, age group, genetic markers), you can identify which exposures are most strongly associated with the disease.
- Synthesize evidence: Meta-analysis allows combining odds ratios from multiple studies to produce a summary effect estimate, which helps determine overall strength of association and consistency across populations.
Example Table of Interpreting Odds Ratios
These odds ratios can guide targeted interventions, identify priority risk factors, and inform clinical decision-making or public health policy.
Each odds ratio’s confidence interval should be considered to determine statistical significance: if it includes 1, the specific association may not be statistically meaningful.
Summary
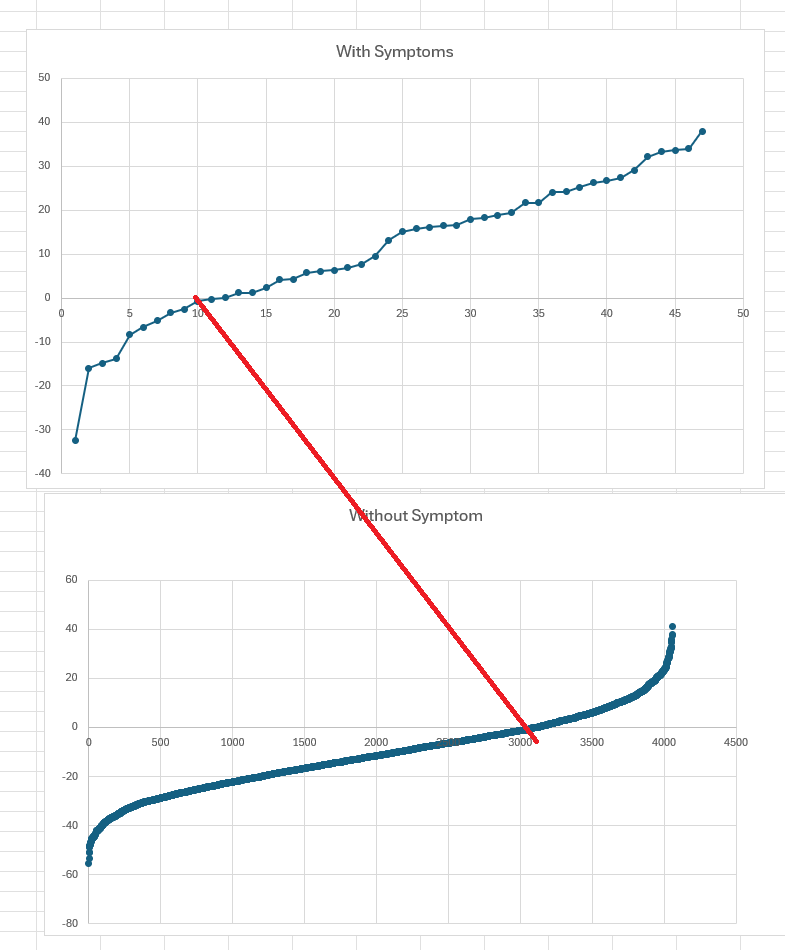
The charts below used naïve odds ratio computation (ignoring Probability) of people with declared symptom and those without this symptoms. If you use Zero(0) as a threshold, we correctly predicted 74% of the time for those with symptoms and those without symptoms.
Odds ratios quantify the likelihood of disease or symptoms given exposures and allow comparison and synthesis of risk across different factors or populations. When handling multiple odds ratios, use them to identify, adjust for, and summarize the impact of risk factors on disease occurrence.
Applying to the Microbiome
We encounter some challenges here. Consider this constructed example:
- Bacteria Foo has OR of 1.5 when the microbiome exceeds 5%
- Bacteria Bar has OR of 2 when the microbiome exceeds 3%
- Bacteria Foo and Bar are associated.
If a sample has both, the OR is not 1.5 x 2 or 3.0. Instead, we need to know much they influence each other, i.e. the R2. We can estimate this from Microbiome Taxa R2 Site. Suppose that R2 is 0.5, significant inference.
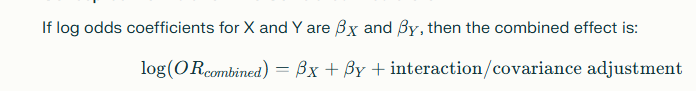
The Odds ratio is thus reduced to 2.66 from 3.0.
Odds Ratios and Continuous Values
Odds ratios are commonly used for binary data, such as smoker versus non-smoker or high school graduation status. Continuous data can also be categorized; for example, instead of treating smoking as simply yes/no, you might use metrics like the number of cigarettes smoked per day or packs per week. Similarly, the microbiome data can be categorized, though caution is needed to avoid over-interpreting sparse data. A rough guideline from many studies suggests a minimum of 30 cases and 30 controls are needed to calculate an odds ratio with basic reliability. For data on the lower end, it can be helpful to binarize using the median rather than the mean. This is important because bacterial abundances tend to be highly skewed—using the mean often results in about 70% of samples falling below it and 30% above, whereas the median splits the data evenly with 50% below and 50% above.
Example: Brain Fog
Here are some odds ratios using BiomeSight data. Odds Low means when the reading is below the Median and Odds High above the Median (of those with this symptom). We use the symptom median to get balanced (same approximate size) categories.
A few quick take away:
- Probiotics such as Bifidobacterium, Ligilactobacillus, Lactococcus lactis, Lactiplantibacillus
- Bifidobacterium catenulatum subsp. kashiwanohense (OR 1.37) is the preferred one!
- Ligilactobacillus: Ligilactobacillus salivarius is the only one available retail
- Lactiplantibacillus: Lactiplantibacillus plantarum is the only one available retail
- Veillonella atypica is offered as FITBIOMICS V•Nella Lactic Acid Metabolizing Probiotic …
- Note: Brain fog is often ascribed to too much Lactic Acid.
| Tax_Name | tax_Rank | Odds Low | Odd High |
| Cerasicoccus arenae | species | 1.59 | 0.71 |
| Polyangia | subclass | 1.47 | 0.72 |
| Lelliottia | genus | 1.42 | 0.75 |
| Lelliottia amnigena | species | 1.42 | 0.75 |
| Microcoleaceae | family | 0.82 | 1.41 |
| Myxococcia | class | 1.38 | 0.71 |
| Myxococcales | order | 1.38 | 0.71 |
| Myxococcota | phylum | 1.38 | 0.71 |
| Bifidobacterium catenulatum subsp. kashiwanohense | subspecies | 1.37 | 0.74 |
| Denitratisoma | genus | 0.87 | 1.37 |
| Microcoleus antarcticus | species | 0.81 | 1.36 |
| Microcoleus | genus | 0.81 | 1.36 |
| Desulfosporosinus | genus | 1.34 | 0.80 |
| Trabulsiella | genus | 1.33 | 0.80 |
| Rivulariaceae | family | 1.32 | 0.79 |
| Segatella paludivivens | species | 1.32 | 0.79 |
| Prosthecobacter | genus | 1.32 | 0.73 |
| Ligilactobacillus | genus | 1.31 | 0.77 |
| Enterobacter cloacae complex | species group | 1.30 | 0.80 |
| Peptostreptococcus stomatis | species | 1.30 | 0.80 |
| Alcanivorax | genus | 0.93 | 1.30 |
| Alcanivoracaceae | family | 0.93 | 1.30 |
| Tepidanaerobacter syntrophicus | species | 1.30 | 0.79 |
| Tepidanaerobacter | genus | 1.30 | 0.79 |
| Tepidanaerobacteraceae | family | 1.30 | 0.79 |
| Hoylesella loescheii | species | 1.29 | 0.81 |
| Thermosediminibacterales | order | 1.28 | 0.81 |
| Enterobacter hormaechei | species | 1.28 | 0.82 |
| Slackia isoflavoniconvertens | species | 0.84 | 1.27 |
| Bifidobacterium choerinum | species | 1.27 | 0.82 |
| Desulfovibrio simplex | species | 1.27 | 0.80 |
| Chromatium | genus | 0.90 | 1.27 |
| Lactococcus fujiensis | species | 1.27 | 0.67 |
| Chromatium weissei | species | 0.90 | 1.27 |
| Klebsiella | genus | 1.27 | 0.82 |
| Klebsiella/Raoultella group | no rank | 1.27 | 0.82 |
| Veillonella atypica | species | 1.26 | 0.82 |
| Isoalcanivorax | genus | 0.94 | 1.26 |
| Isoalcanivorax indicus | species | 0.94 | 1.26 |
| Schaalia turicensis | species | 1.25 | 0.72 |
| Lactococcus lactis | species | 1.25 | 0.83 |
| Bifidobacteriaceae | family | 1.24 | 0.84 |
| Bifidobacteriales | order | 1.24 | 0.84 |
| Chloroflexota | phylum | 1.24 | 0.79 |
| Salidesulfovibrio brasiliensis | species | 0.92 | 1.24 |
| Salidesulfovibrio | genus | 0.92 | 1.24 |
| Enterobacter | genus | 1.24 | 0.81 |
| Bifidobacterium | genus | 1.24 | 0.84 |
| Actinomycetota | phylum | 1.24 | 0.84 |
| Acholeplasma hippikon | species | 0.85 | 1.23 |
| Mycoplasmataceae | family | 1.23 | 0.82 |
| Mycoplasmatales | order | 1.23 | 0.82 |
| Bifidobacterium angulatum | species | 1.23 | 0.82 |
| Clostridium nitrophenolicum | species | 0.85 | 1.23 |
| Bacteroides uniformis | species | 0.85 | 1.22 |
| Lactococcus | genus | 1.22 | 0.83 |
| Lactiplantibacillus | genus | 1.22 | 0.84 |
| Mycoplasma | genus | 1.22 | 0.82 |
| Filifactor villosus | species | 0.88 | 1.22 |
| Anaerolineae | class | 1.21 | 0.85 |
| Veillonella denticariosi | species | 0.89 | 1.21 |
| Actinomycetes | class | 1.21 | 0.85 |
| Acidimicrobium | genus | 1.21 | 0.79 |
| Cerasicoccaceae | family | 1.21 | 0.79 |
| Cerasicoccus | genus | 1.21 | 0.79 |
| Mycoplasmoidales | order | 1.21 | 0.81 |
| Parabacteroides gordonii | species | 1.21 | 0.84 |
| Thioalkalivibrio jannaschii | species | 1.21 | 0.63 |
| Candidatus Blochmanniella camponoti | species | 1.21 | 0.79 |
| Thioalkalivibrio | genus | 1.21 | 0.63 |
| Acidimicrobiaceae | family | 1.21 | 0.77 |
| Bifidobacterium adolescentis | species | 1.21 | 0.85 |
| Bifidobacterium longum | species | 1.21 | 0.85 |
That’s it for the moment
Also, see the links below for by-request tables
- Odds Ratio Snapshots: Histamine or Mast Cell issues
- Odds Ratio Snapshots: Official Diagnosis: Chronic Fatigue Syndrome (CFS/ME)
- Odds Ratio Snapshot: ME/CFS without IBS
- Odds Ratio Snapshot: ME/CFS with IBS
- Odds Ratio Snapshots: Unrefreshed sleep
- Odds Ratio Snapshots: Neurocognitive: Brain Fog
- Odds Ratio Snapshots: Histamine or Mast Cell issues
- Odds Ratio Snapshots: Unrefreshed sleep
- Odds Ratio Snapshots: Neurocognitive: Brain Fog
- Odds Ratios for Neurological-Audio: hypersensitivity to noise
The next step is seeing how these odds ratio perform against samples and against the old algorithm. Stay tune.
Special note: This is not based on using averages of healthy populations, but more on the skewness of the distribution of those with the symptom. It is a different way of thinking about the issue.
caveat emptor
The table above applies only and exclusively with Biomesight data. For an explanation of why, see The taxonomy nightmare before Christmas… If you use a different lab, you will need to get that lab to crunch their numbers in the same manner as detailed above
Recent Comments