A person who suffered from Multiple Chemical Sensitivity(MCS) for many years before it progressed into Mast Cell Syndrome(MCAS) forward an article, “Chemical Intolerance and Mast Cell Activation: A Suspicious Synchronicity“, 2023. At the same time, my understanding of the complex nature of the microbiome also made a leap forward. For those interested, see these three very technical posts:
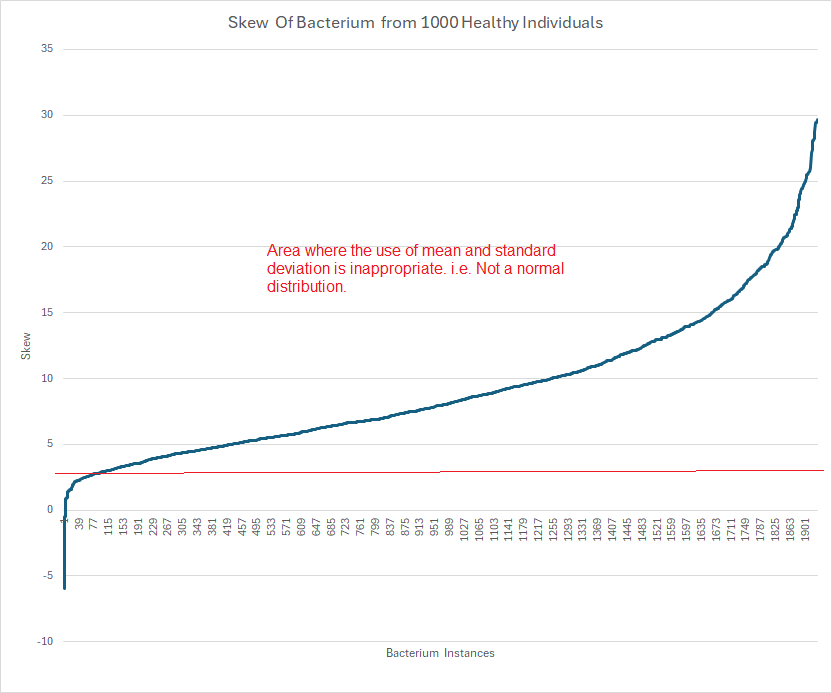
- Using Mean and Standard Deviation for Bacteria is Inappropriate.
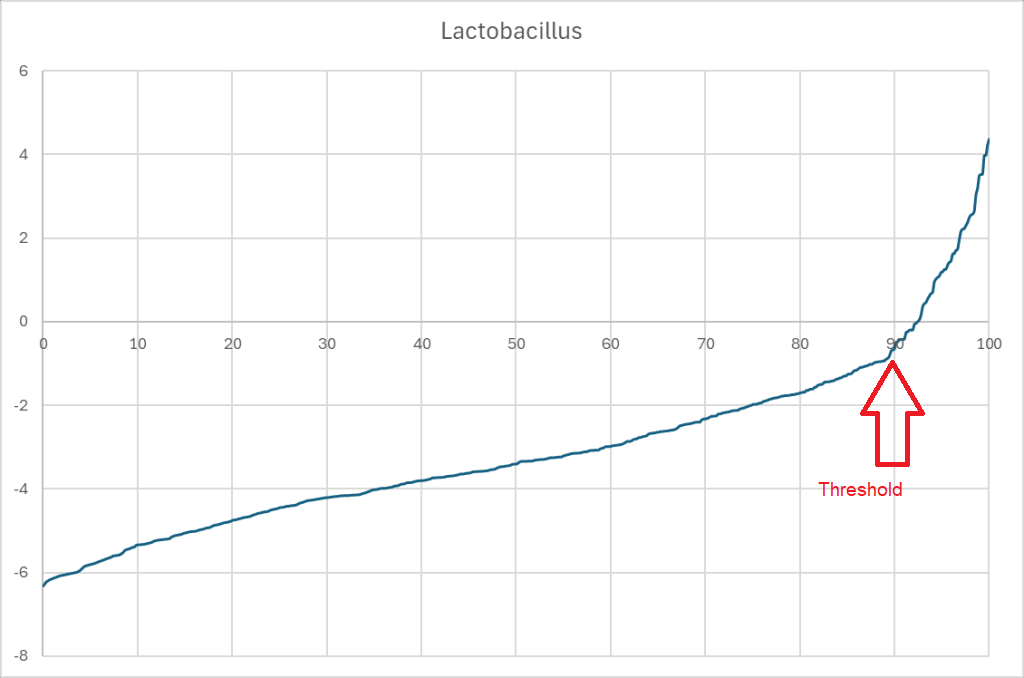
- Significant Bacteria and Their Thresholds – Part 1
- Significant Bacteria and Their Thresholds – Part 2
I decided to look at Mast Cell Activation Syndrome again in the hope of gaining insight into treatment possibilities.
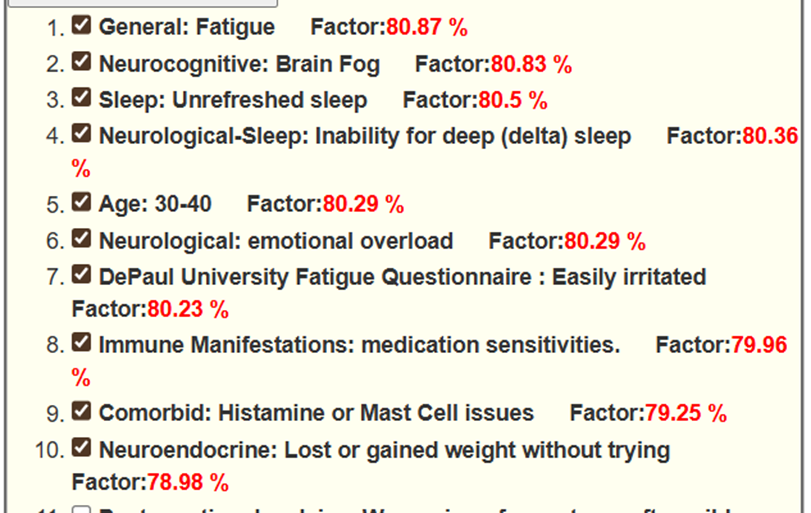
The samples being using are donated by readers from various labs with symptoms being self-declared. Symptoms may not agree with clinical definitions. All of the data is freely available for those that are highly skilled with statistics at Citizen Science Distribution.
First, MCS::MCAS
| With MCAS | With MCS | WITH MCAS and MCS | With Any Symptoms | |
| Count | 305 | 219 | 62 | 3025 |
| Percentage | 10% | 7.2% | 2% |
- If MCAS and MCS are independent, we would expect 10% x 7.2% or 0.72% overall. We have 3 times more than expected.
- The chi-square statistic is 19.3693. The p-value is .000011. VERY SIGNIFICANT CONNECTION.
This disagrees on face value with the reported “Our outcomes confirm the previously published study where the majority of MCAS patients also have CI. ” For this to be true, With MCAS and MCS would be > 150. Differences in methodology may be the cause for this disagreement, but regardless, we see that a person with MCAS is around three times more likely to have had MCS. I read this as suggesting that MCS is a precursor for a class of MCAS. Having MCS prior is not required to developing MCAS; but having MCS means the odds of getting MCAS are much increased.
Looking at Bacterium
I am going to use samples processed through Biomesight only because it is the largest sample set.
For MCS
The table below is filtered to those with P < 0.001 at the genus level with the highest first (P < 5.19132E-05).
| Name | Direction |
| Actinocatenispora | Low |
| Hathewaya | High |
| Thauera | Low |
| Devosia | Low |
| Thiocapsa | Low |
| Deferribacter | Low |
| Viridibacillus | Low |
| Candidatus Tammella | Low |
| Coraliomargarita | Low |
| Geothrix | Low |
| Desulfosporosinus | Low |
| Glutamicibacter | Low |
| Denitratisoma | Low |
| Catenibacterium | Low |
| Desulforamulus | Low |
| Geobacter | Low |
| Neisseria | Low |
| Nonomuraea | Low |
| Agromyces | Low |
| Anaerotruncus | High |
| Oenococcus | Low |
| Saccharopolyspora | Low |
| Lentibacillus | Low |
MCAS
The table below is filtered to those with P < 0.001 at the genus level with the highest first (P < 6.25726E-07).
| Name | Direction |
| Emticicia | Low |
| Pseudoramibacter | Low |
| Parascardovia | Low |
| Rickettsia | Low |
| Calothrix | Low |
| Nonomuraea | Low |
| Marinospirillum | Low |
| Azospirillum | Low |
| Neisseria | Low |
| Viridibacillus | Low |
| Helicobacter | Low |
| Peptacetobacter | Low |
| Nitrosococcus | Low |
| Avibacterium | Low |
| Schaalia | Low |
| Propionigenium | Low |
| Flammeovirga | Low |
| Oligella | Low |
| Erysipelothrix | High |
| Geobacter | Low |
| Catenibacterium | Low |
| Pontibacter | Low |
| Isoalcanivorax | Low |
| Faecalitalea | Low |
| Jonesia | Low |
| Thalassospira | Low |
| Amedibacillus | High |
| Arthrobacter | Low |
| Hathewaya | High |
MCAS and MCS
The table below is filtered to those with P < 0.001 with the highest first (P < 1.85255E-05). The sample size is much smaller, so fewer items were significant, hence all ranks are shown.
| Name | Rank | Direction |
| Chloroflexota | phylum | Low |
| Anaerolineae | class | Low |
| Eggerthella sinensis | species | Low |
| Desulfofundulus | genus | Low |
Probiotic Remedies?
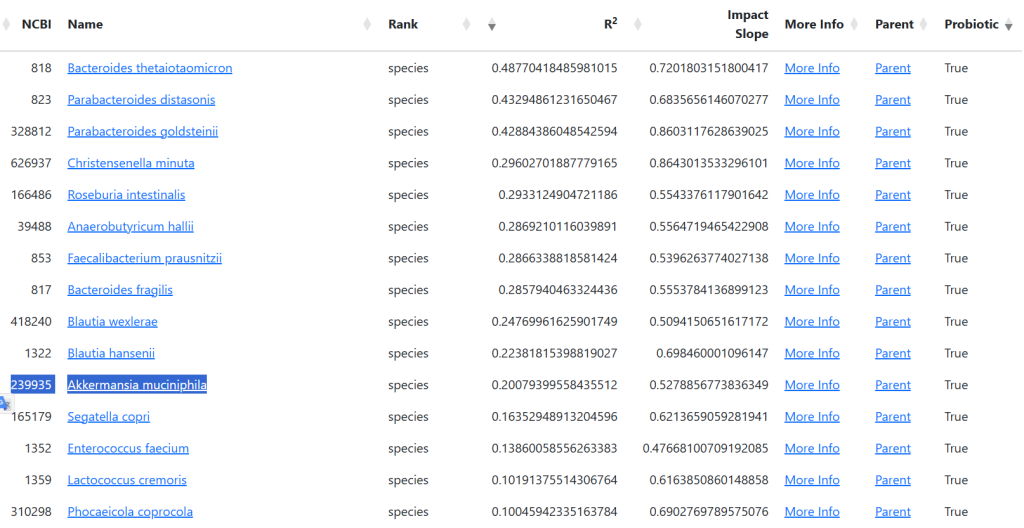
Because there are simply no published studies on most of the above bacterium, I went over to the R2 site to compute candidate probiotics. Note: Some of these probiotics are still in development or available only in some countries.
MCS
I enclosed the full list because you want to make sure NOT to take any with a Net being negative. Also, the safest are those with BAD being Zero (0)
| Tax_Name | Tax_Rank | Good | Bad | Net |
| Christensenella minuta | species | 194 | 29 | 165 |
| Aspergillus oryzae | species | 138 | 0 | 138 |
| Faecalibacterium prausnitzii | species | 185 | 78 | 107 |
| Anaerobutyricum hallii | species | 162 | 58 | 104 |
| Enterococcus faecium | species | 124 | 37 | 87 |
| Blautia hansenii | species | 122 | 37 | 85 |
| Lactiplantibacillus plantarum | species | 64 | 0 | 64 |
| Roseburia intestinalis | species | 118 | 60 | 58 |
| Bifidobacterium catenulatum | species | 53 | 0 | 53 |
| Priestia megaterium | species | 47 | 0 | 47 |
| Bacillus pumilus | species | 43 | 0 | 43 |
| Bacteroides thetaiotaomicron | species | 37 | 0 | 37 |
| Latilactobacillus sakei | species | 37 | 0 | 37 |
| Bifidobacterium breve | species | 32 | 0 | 32 |
| Levilactobacillus brevis | species | 31 | 0 | 31 |
| Parabacteroides distasonis | species | 31 | 0 | 31 |
| Parabacteroides goldsteinii | species | 54 | 28 | 26 |
| Pediococcus pentosaceus | species | 25 | 0 | 25 |
| Limosilactobacillus reuteri | species | 23 | 0 | 23 |
| Shouchella clausii | species | 23 | 0 | 23 |
| Lactiplantibacillus argentoratensis | species | 23 | 0 | 23 |
| Bifidobacterium longum | species | 20 | 0 | 20 |
| Bifidobacterium adolescentis | species | 39 | 21 | 18 |
| Blautia wexlerae | species | 74 | 57 | 17 |
| Lactococcus cremoris | species | 36 | 21 | 15 |
| Enterococcus faecalis | species | 14 | 0 | 14 |
| Bifidobacterium pseudocatenulatum | species | 13 | 0 | 13 |
| Limosilactobacillus vaginalis | species | 12 | 0 | 12 |
| Lactobacillus kefiranofaciens | species | 12 | 0 | 12 |
| Lactococcus lactis | species | 11 | 0 | 11 |
| Clostridium beijerinckii | species | 11 | 0 | 11 |
| Streptococcus thermophilus | species | 10 | 0 | 10 |
| Leuconostoc mesenteroides | species | 10 | 0 | 10 |
| Segatella copri | species | 37 | 29 | 8 |
| Phocaeicola coprocola | species | 27 | 21 | 6 |
| Bacillus subtilis | species | 26 | 21 | 5 |
| Lactobacillus crispatus | species | 11 | 11 | 0 |
| Lactiplantibacillus pentosus | species | 0 | 11 | -11 |
| Bacteroides uniformis | species | 20 | 32 | -12 |
| Limosilactobacillus mucosae | species | 0 | 14 | -14 |
| Lacticaseibacillus casei | species | 0 | 17 | -17 |
| Bacillus cereus | species | 33 | 54 | -21 |
| Bacillus licheniformis | species | 0 | 22 | -22 |
| Ligilactobacillus salivarius | species | 11 | 41 | -30 |
| Lactobacillus jensenii | species | 0 | 36 | -36 |
| Akkermansia muciniphila | species | 12 | 50 | -38 |
MCAS
| Tax_Name | Tax_Rank | Good | Bad | Net |
| Christensenella minuta | species | 83 | 0 | 83 |
| Aspergillus oryzae | species | 68 | 0 | 68 |
| Enterococcus faecium | species | 58 | 0 | 58 |
| Faecalibacterium prausnitzii | species | 53 | 0 | 53 |
| Roseburia intestinalis | species | 53 | 0 | 53 |
| Anaerobutyricum hallii | species | 51 | 0 | 51 |
| Blautia wexlerae | species | 44 | 0 | 44 |
| Bacillus pumilus | species | 28 | 0 | 28 |
| Priestia megaterium | species | 27 | 0 | 27 |
| Levilactobacillus brevis | species | 25 | 0 | 25 |
| Latilactobacillus sakei | species | 25 | 0 | 25 |
| Lactiplantibacillus argentoratensis | species | 23 | 0 | 23 |
| Blautia hansenii | species | 22 | 0 | 22 |
| Limosilactobacillus fermentum | species | 21 | 0 | 21 |
| Shouchella clausii | species | 20 | 0 | 20 |
| Limosilactobacillus reuteri | species | 18 | 0 | 18 |
| Lactiplantibacillus plantarum | species | 17 | 0 | 17 |
| Bacillus subtilis | species | 16 | 0 | 16 |
| Bifidobacterium animalis | species | 15 | 0 | 15 |
| Bifidobacterium animalis subsp. lactis | subspecies | 15 | 0 | 15 |
| Lactobacillus acidophilus | species | 14 | 0 | 14 |
| Clostridium butyricum | species | 13 | 0 | 13 |
| Bifidobacterium adolescentis | species | 12 | 0 | 12 |
| Ligilactobacillus salivarius | species | 11 | 0 | 11 |
| Hafnia alvei | species | 11 | 0 | 11 |
| Bacteroides uniformis | species | 0 | 15 | -15 |
| Lacticaseibacillus rhamnosus | species | 0 | 16 | -16 |
| Bacteroides fragilis | species | 0 | 23 | -23 |
Bottom Line
The most confidence is to work on probiotics only with the following being strongly recommended.
- Aspergillus oryzae
- Enterococcus faecium
- Bacillus pumilus
- Bacillus subtilis
- Lactiplantibacillus plantarum a.k.a. Lactobacillus plantarum
- Bifidobacterium catenulatum
- Bifidobacterium breve
- Levilactobacillus brevis a.k.a. Lactobacillus brevis
- Latilactobacillus sakei a.k.a. Lactobacillus sakei
- Limosilactobacillus reuteri a.k.a. Lactobacillus reuteri
- Shouchella clausii a.k.a. Bacillus Clausii
- Lactobacillus acidophilus
- Ligilactobacillus salivarius a.k.a. Lactobacillus salivarius
The top one for both is Aspergillus oryzae. This is likely unfamiliar to most people. It is also known as Shirayuri Koji. It is available on Amazon, not as a probiotic but cooking additive!! It is in Koji Rice. It is also solid as strong wakamoto w


With Tariffs ordering from Japan can get expensive, https://www.yami.com/ ships from the US, so no tariffs costs!
CAUTION: This is based on modelled data and not verified by clinical studies. IMHO, it is likely a superior set of suggestions than other more “conventional” approaches.
Recent Comments