This week I refactor the genus association algorithm resulting in clearer results. I also change it so the common person can understand what is being reported.
The core is that once we convert percentage to percentiles, we end up with a “flat” or uniform distribution. For any genus, we have the same number in 0-10%ile, 50-60%ile and 90-100%. If there is no association, we should see the same number in the 0-16%ile and 84-100%ile. If there are not, we can compute the statistical significance (I picked p < 0.01 or one chance in 100 of not being a true association).
Below, we will cover 2 pages and a FYI:
- Extreme Association
- Overview by symptoms Citizen Science Symptoms To Genus Special Studies (microbiomeprescription.com)
- Genus identification
Extreme Associations
Processing without considering genus (i.e. all tax ranks) The following association occurs with extremely high statistical associations to many conditions.
This does not mean that it is a cause, but may indicate these bacteria prosper with the disruption associated with the condition. An example is below
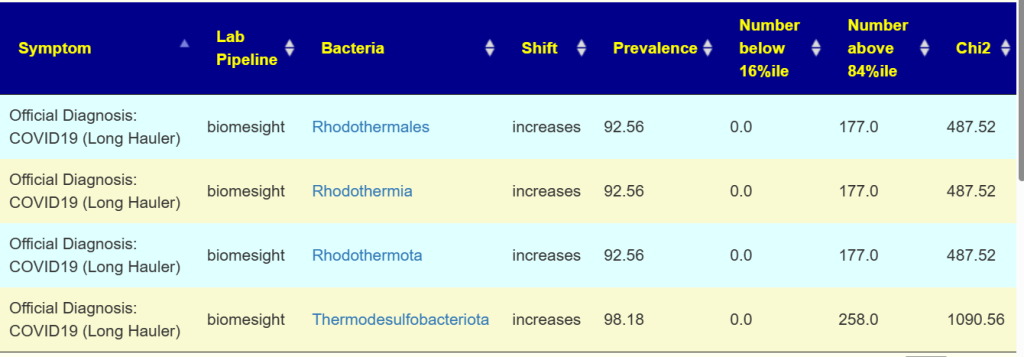
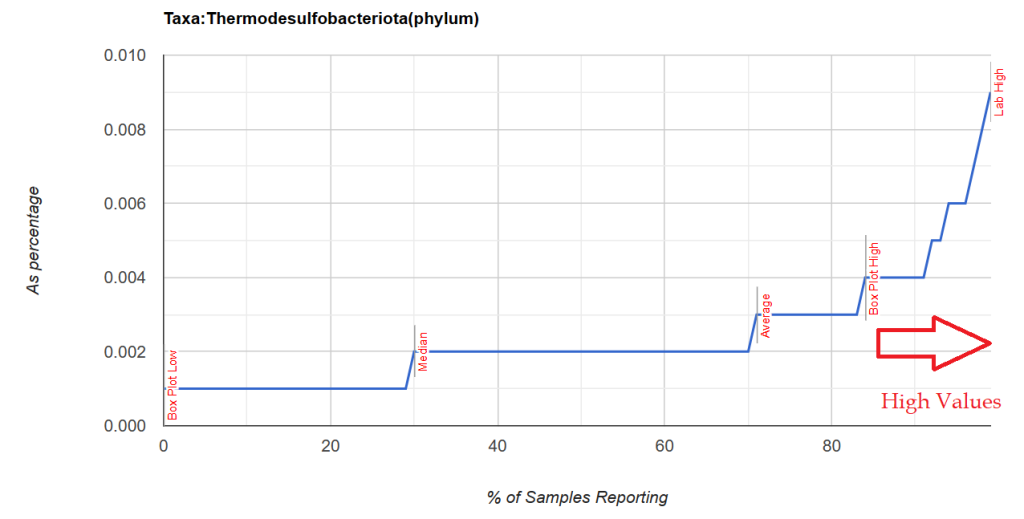
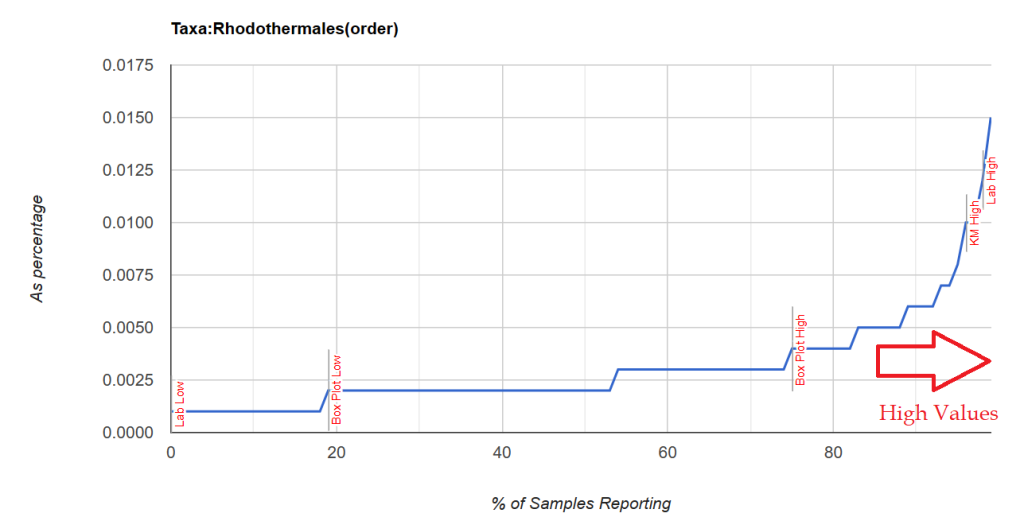
Note that these are almost always present, it is when the percentile ranking exceeds 84%ile that we have a strong indicator which is illustrated below with two distributions. Note that the amount is small.
Unfortunately, restricting to genus level resulted in nothing.
Overview by symptom
This lists all of the symptoms found significant in various lab processing pipeline. The number depends on the number of samples contributed and the number of samples annotated with symptoms. This page is recomputed and updated on the 2nd of each month; more data means more associations.

Note Taxa identification is fuzzy and should never be assumed to be “correct”. The same FASTQ file processed thru ubiome, Ombre, Biomesight and Sequentia biotech; resulted in different genus being reported with different amounts. Clearly, the associations is processing pipeline dependent.
Genus identification
Looking at Immune Manifestations: Constipation we can compare results across different tests


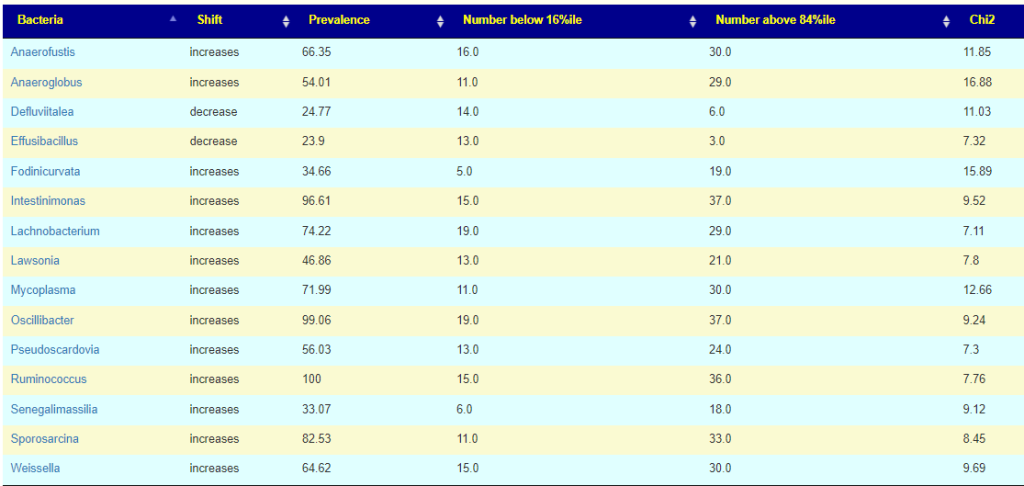
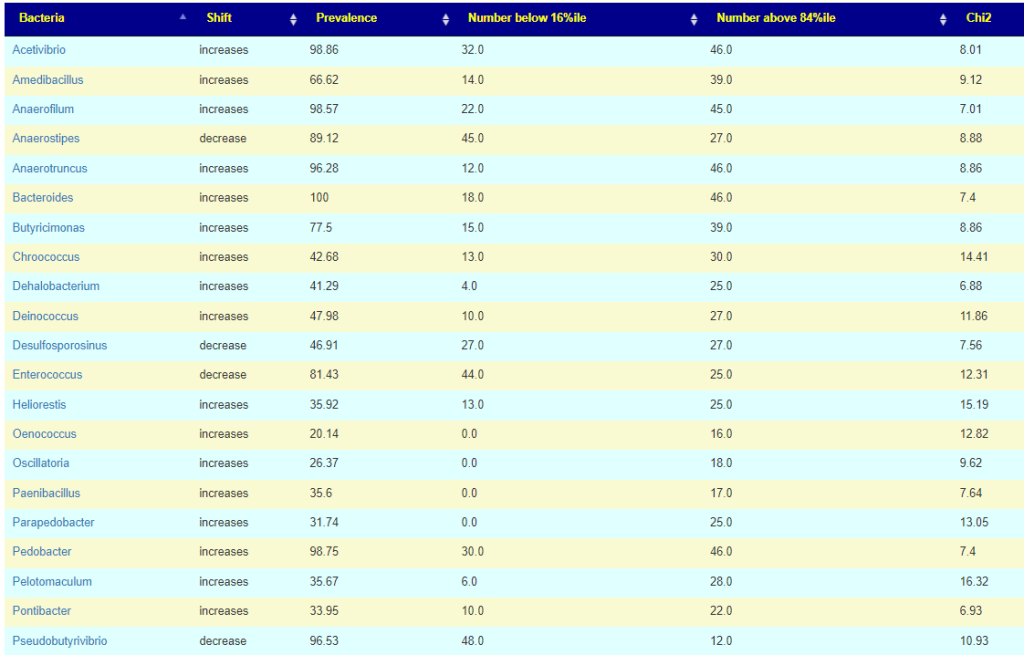
We see the 3 are in consensus for Butyricimonas being increased and one is silent. We see 2 are in consensus for Lachnobacterium being increased, and two are silent (at the moment, waiting for more data). Two are in consensus for Desulfosporosinus being decreased with two silent.
The lab processing pipeline is very significant for detection rate (for Butyricimonas , one detects it 57% or the time and another lab 77% of the time) and the amount reported.
Recent Comments