This post started out seeking to confirm or debunk the claim located here.

The method was very simple because we have a continuous stream of samples from before COVID, before the COVID vaccination and after the majority of people uploading samples would have been vaccinated. If this massive change is happening then the pre-COVID bifidobacterium count (by lab) would be much higher than the post-COVID vaccination bifidobacterium counts.
My results: there was no statistical significance between the averages
- Pre 2020-01-01: Average Count 20380 on 118 samples, Std Dev 98300
- Post 2022-06-01: Average Count 26111 on 406 samples, Std Dev 72700
That is a 28% increase when a decrease was expected from the above talk.
I am open data, so you can pull the data and check the calculations:
Volatility of Numbers
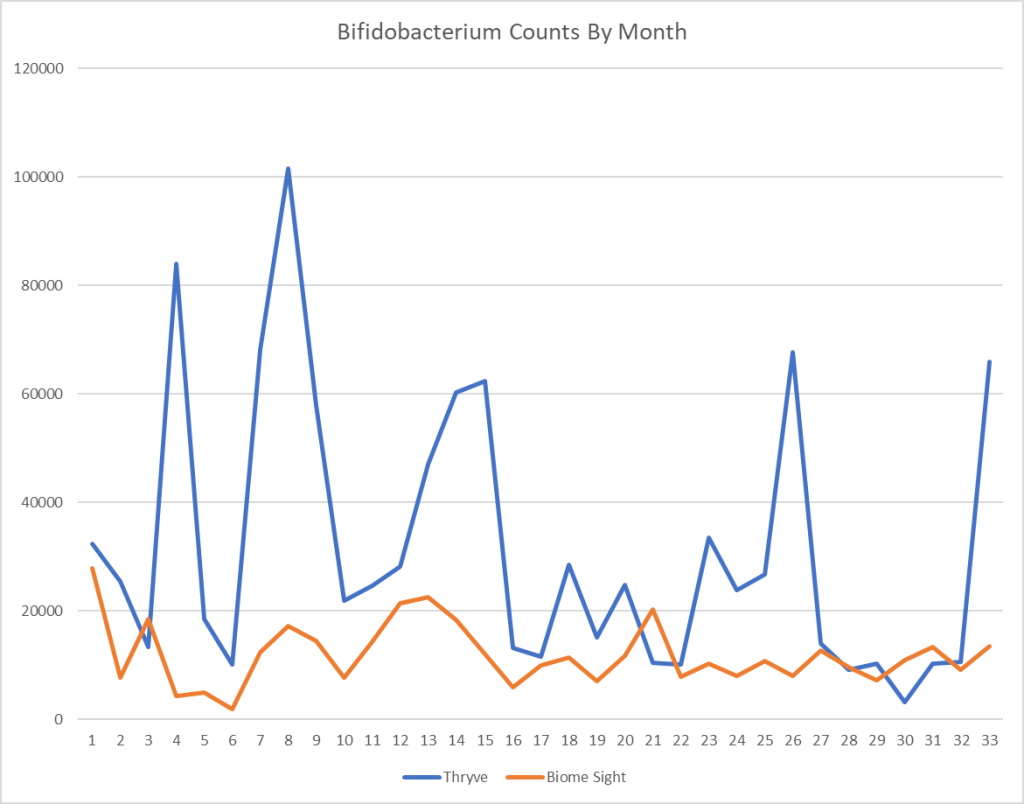
I was also curious to see if there was any apparent month by month pattern, so I pulled the statistics for biidobacterium, shown below. It is illuminating to a statistician like me, perhaps confusing or concerning to people with poor understanding of statistics (who would expect the numbers from month to month to be similar).
| Thryve | BiomeSight | ||||||
| Year | Month | Average | Std Dev | Obs | Average | Std Dev | Obs |
| 2020 | 7 | 32438 | 131646 | 24 | 27929 | 35826 | 14 |
| 2020 | 8 | 25456 | 43405 | 21 | 7683 | 8948 | 9 |
| 2020 | 9 | 13410 | 19329 | 17 | 18501 | 22566 | 14 |
| 2020 | 10 | 84056 | 148144 | 18 | 4370 | 7390 | 20 |
| 2020 | 11 | 18598 | 34049 | 9 | 4926 | 8197 | 13 |
| 2020 | 12 | 10078 | 17108 | 16 | 1841 | 2718 | 29 |
| 2021 | 1 | 68152 | 172405 | 20 | 12436 | 20675 | 32 |
| 2021 | 2 | 101600 | 163980 | 30 | 17289 | 55509 | 45 |
| 2021 | 3 | 57957 | 103248 | 17 | 14482 | 33774 | 33 |
| 2021 | 4 | 21979 | 42967 | 30 | 7700 | 24436 | 46 |
| 2021 | 5 | 24693 | 51744 | 56 | 14257 | 33608 | 38 |
| 2021 | 6 | 28166 | 84491 | 39 | 21465 | 85762 | 51 |
| 2021 | 7 | 47023 | 105209 | 39 | 22620 | 67229 | 51 |
| 2021 | 8 | 60283 | 82398 | 43 | 18427 | 79784 | 37 |
| 2021 | 9 | 62438 | 92929 | 28 | 12002 | 19635 | 41 |
| 2021 | 10 | 13121 | 29924 | 24 | 5922 | 8565 | 38 |
| 2021 | 11 | 11515 | 27095 | 57 | 9996 | 24966 | 58 |
| 2021 | 12 | 28582 | 80191 | 17 | 11498 | 29919 | 63 |
| 2022 | 1 | 15114 | 28760 | 38 | 7076 | 15149 | 50 |
| 2022 | 2 | 24816 | 59069 | 32 | 11707 | 27202 | 52 |
| 2022 | 3 | 10486 | 23995 | 33 | 20243 | 51539 | 47 |
| 2022 | 4 | 10207 | 21580 | 57 | 7916 | 18288 | 69 |
| 2022 | 5 | 33471 | 82497 | 80 | 10304 | 23719 | 81 |
| 2022 | 6 | 23861 | 60126 | 53 | 8053 | 21994 | 235 |
| 2022 | 7 | 26797 | 109435 | 40 | 10709 | 20439 | 62 |
| 2022 | 8 | 67707 | 132108 | 60 | 8085 | 17190 | 85 |
| 2022 | 9 | 13926 | 17622 | 28 | 12635 | 21332 | 92 |
| 2022 | 10 | 9090 | 14049 | 45 | 9627 | 21171 | 89 |
| 2022 | 11 | 10296 | 19034 | 39 | 7293 | 12150 | 61 |
| 2022 | 12 | 3186 | 6194 | 21 | 10887 | 21390 | 42 |
| 2023 | 1 | 10224 | 18215 | 41 | 13302 | 21612 | 89 |
| 2023 | 2 | 10604 | 22883 | 52 | 9103 | 19781 | 72 |
| 2023 | 3 | 65953 | 78173 | 30 | 13566 | 34256 | 57 |

My conclusion is that you need to have two things to get good results:
- All of the samples should be processed by the same lab at the same time. Different batches of reagents may cause different results.
- You need good sample sizes, at least 100+
- You need to be very very careful not to cherry pick data (example below)
An example from Thryve/Ombre data above, with a sample size of 30, the average was 101600. Later a sample size of 21 reported just 3186. Conclusion: going back to school caused family bifidobacterium to tank!

On sample size of 100 issue:


Recent Comments