Exploration in Picking Critical Bacteria

This is a continuation of a nerdy technical series with Predicting Conditions from PubMed Studies earlier. I continue using depression as my canary. We use two data sets from two different retail providers: Ombre Labs (USA) and Biomesight (UK).

Means, T-Scores – Walking Two Paths

There are two paths available, with no clear best choice:

  • Compare averages from samples that reported some amount (thus excluding zero values)
    • Lower degree of freedom and thus T-Scores
  • Compare averages from samples with a zero being used when an item is not reported.
    • Higher degrees of freedom and higher T-Scores

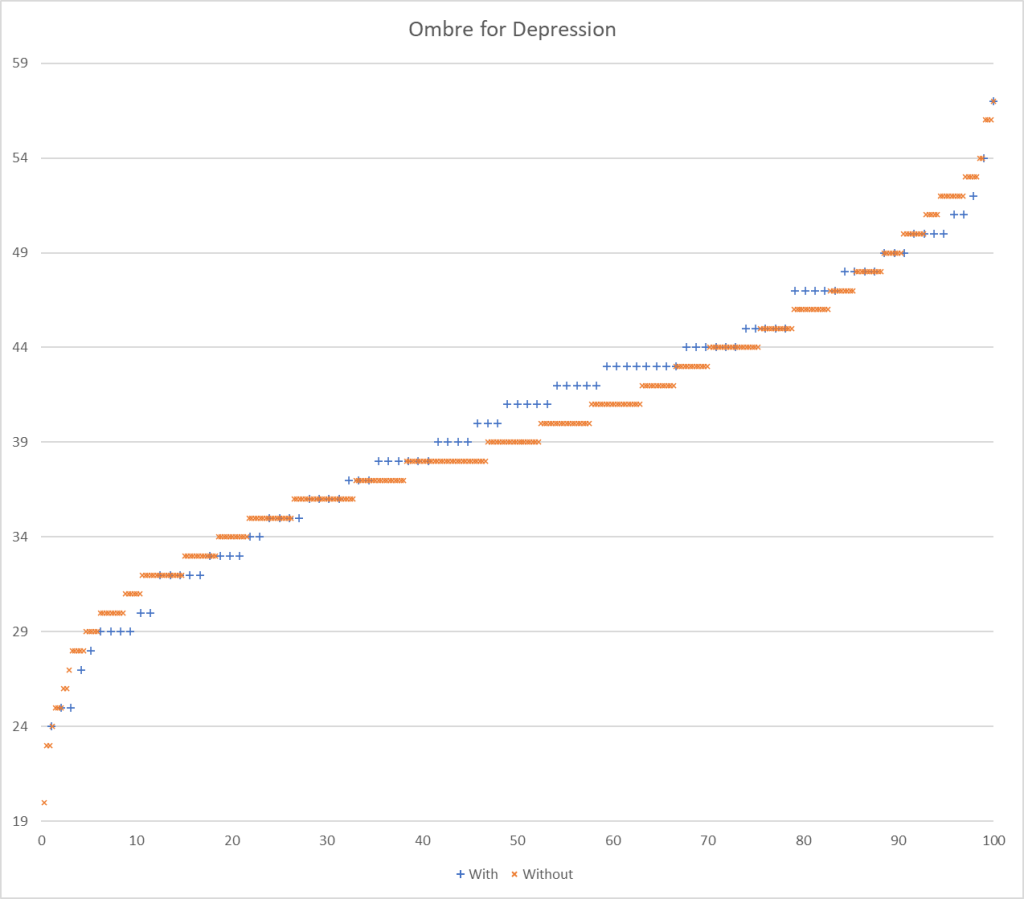
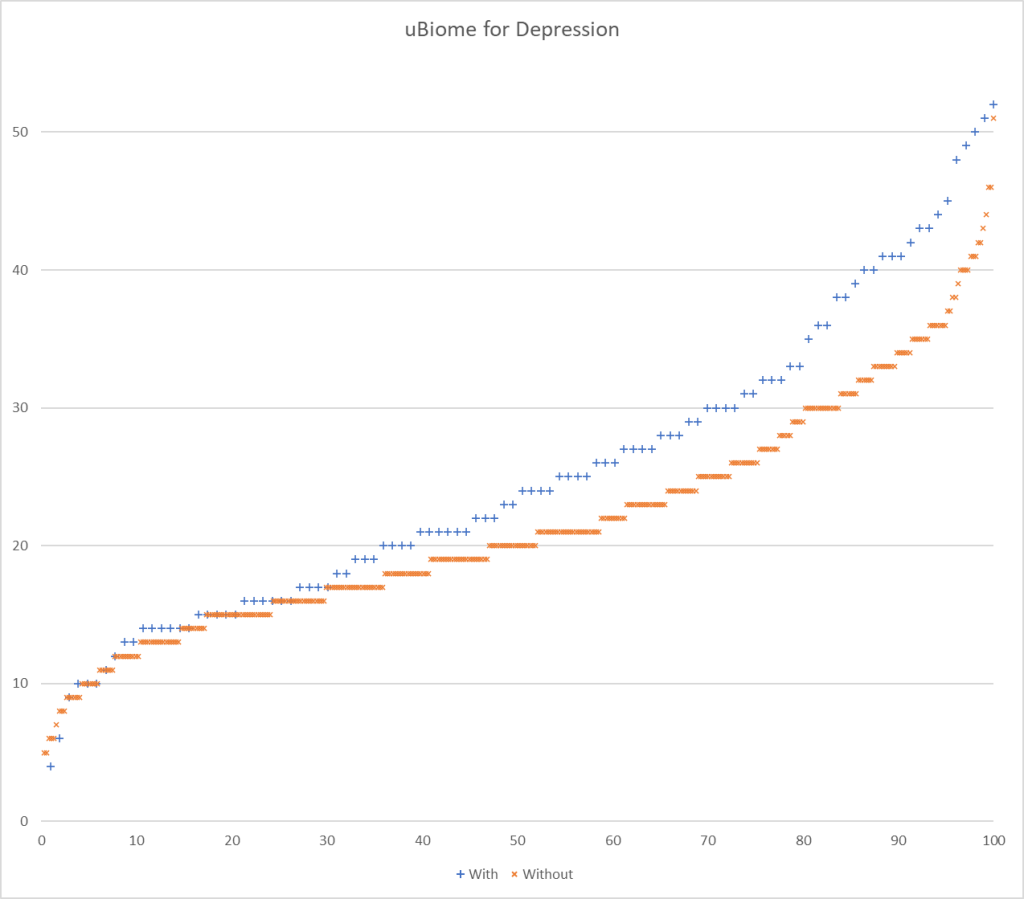
Picking one or the other of these paths seems to be done a priori by most researchers. To get a feel for the differences, I processed data from Ombre Labs and Biome Sight by both methods. Ombre Labs is almost solely from American Samples. BiomeSight is from around the world. The data suggests that Americans are more prone to depression.

MeasureBiomesightOmbre Labs
Bacteria Taxon Seen1,8782,586
With Depression87101
Without Depression639343
Percentage with Depression Reported12%23%
Highest T-Score with reported only (No Zero values)9560
ABs(T-Score) over 3.2 (No Zero values)11351185
Highest T-Score with Zero if missing282176
Abs(T-Score) over 3.2 (with Zero if missing)13911492
Highest Composite T-Score (Sqrt of the above t-score multiple by each other)15892
Composite T-Score over 3.2 ( < 0.001)11931306
Percentage of Bacteria with T-Score over 3.263%50%
Larger total sample size results in higher t-scores

We then did a composite T-Score between the two labs by bacteria to see the best indicators (in decreasing order of significance). We then compared to results from studies on the US National Library of Medicine

BacteriaDepressionPubMed
Blautia wexleraeIncreasedGenus has 50% high and 50% low
CatonellaIncreased
Catonella morbiIncreased
PseudobutyrivibrioIncreased
ClostridiaceaeDecreased
Sutterella wadsworthensisDecreasedMatch (genus)
SlackiaIncreasedMatch
AnaerobrancaDecreased
ActinobacillusDecreased
Haemophilus parainfluenzaeDecreasedMatch (genus)
ProteinivoraceaeDecreased
Bacteroides ovatusDecreased
ThermoclostridiumDecreased
EggerthellalesIncreasedMatch
EggerthellaceaeIncreased
ThermoanaerobacteralesIncreased
PrevotellaDecreasedGeneral Match at genus
Veillonella disparDecreasedMatch (genus)
Blautia gluceraseaIncreasedGenus has 50% high and 50% low
Blautia hanseniiIncreasedGenus has 50% high and 50% low
LachnospiraDecreasedGeneral Match at genus
AlphaproteobacteriaIncreased
[Ruminococcus] torquesIncreasedDisagree
Desulfallaceae Watanabe et al. 2020Increased
Bifidobacterium bifidumDecreasedDisagrees, but the genus was a match

Where there was a study available, we had our results in good agreement. Note that our sample sizes far exceed those of any of the studies we found.

We had about 20% less significant bacteria by eliminating those samples with no/zero counts. By requiring both methods to be significant reduces the risk of false positives. In this case, we have an abundance of significant bacteria and such a criteria is viable.

Many of the items deemed very significant were of low frequency of being seen in samples

  • Erwinia tasmaniensis: seen in 7.2% of Biomesight samples, not reported in Ombre.
    • With Condition: Seen in 3% of samples with count of 353 /million
    • Without Condition: Seen in 7.7% of samples with count of 128 / million
    • Significant with excluding (11.2), significant with deeming zero (23)

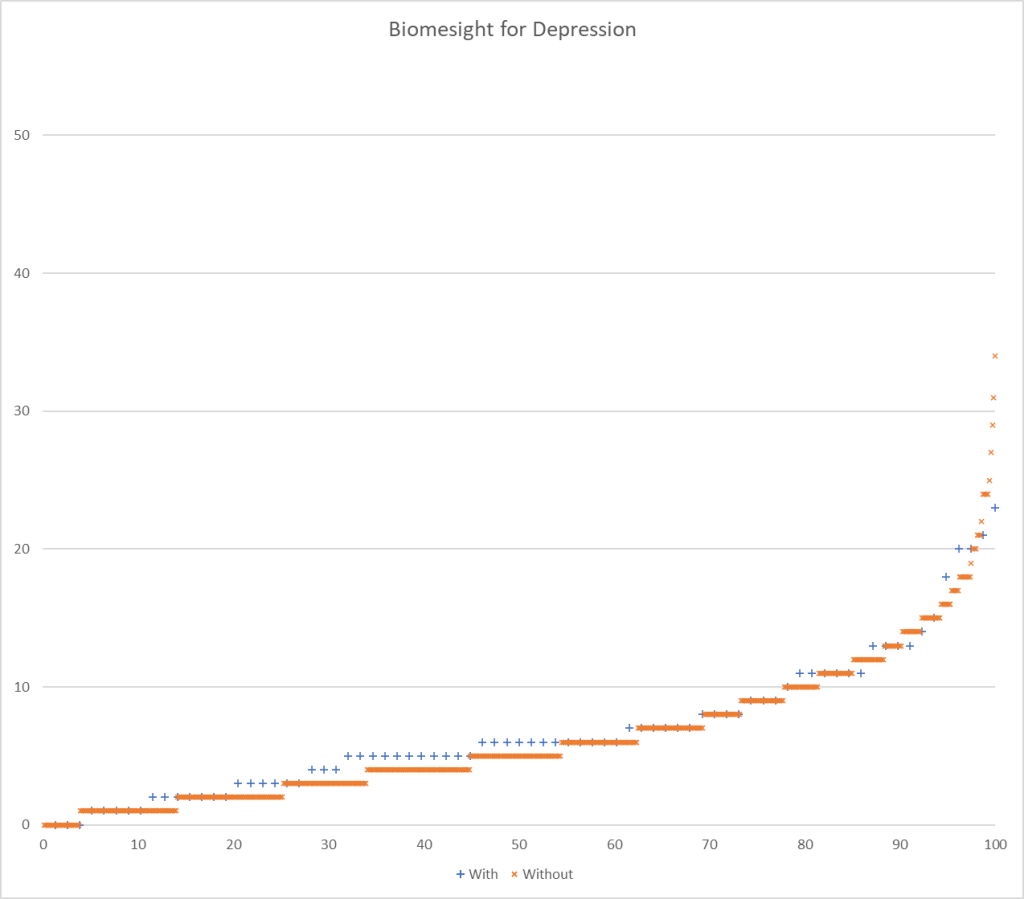
This takes us to the phrase of the analysis: Given a random sample, what is the probability of correctly predicting depression. The end goal is to determine the most influential bacteria responsible for depression. One approach is using random forest on the data trimmed to those bacteria deemed significant or very significant. Another approach is use splines mixed with logistic regression. We must be careful not to shove this problem into an existing square or round hole, instead we need to allow the data to speak to us.

Remember, bacteria do not operate independent of each other. They are highly dependent on the metabolites of each other. Some of my earlier explorations found the KEGG Enzymes estimators were better predictors than bacteria. To be continued.

A Nurse with ME/CFS

Backstory

It all started in February 2018, I am a nurse by profession and after having worked in various cities in my country. I finally got a stable job in my birthplace , my work always caused me stress, and I always thought that sooner or later stress would affect me. I would go to work and notice how the anxiety was going to my digestive system but when my working day ended it was as if a deep sensation of peace would come to me as if a valve opened and let out the gas from a pot..

I have seen that stress is one of the factors that can cause a change in the intestinal microbiota. I was finally diagnosed with a Generalized Anxiety Disorder and Major Depression in September 2018. In September of that year I was also diagnosed with ME/CFS since my fatigue was palpable (non-refreshing sleep). My wisdom teeth were extracted since I was diagnosed with temporomandibular joint dysfunction and I have to say that my instability problems dissipated over the months but everything else remained. Throughout these years I have been struggling with this, without knowing what I really had: CFS/ME, depression, generalized anxiety disorder, irritable bowel syndrome…

But what I do know for sure is that I was a happy person, with a partner, with economic stability, without any debt problem, nor work problems and from one day to the next my life changes to such an extent that I end up with depression and suicidal ideas.

Analysis

This person did the results with Xenogene which gives more information than 16s tests. Unfortunately, they do not provide percentile rankings so we have to borrow those estimates from elsewhere.

The pattern matches that of most people with ME/CFS: over representation of the 0-9%ile. An ideal microbiome should have the number in each 10%ile range being the same.

PercentileGenusSpecies
0 – 92370
10 – 19413
20 – 29816
30 – 391017
40 – 4979
50 – 59413
60 – 69616
70 – 79612
80 – 89217
90 – 9985

Looking at other health issues:

  • Dr. Jason Hawrelak Recommendations is at 89%ile, with the following of most concern:
    • Faecalibacterium prausnitzii – too low (lab agrees)
    • E.Coli — is too high, (lab agrees)
    • Roseburia – too low (Lab identifies one species too low, but two normal)
    • Blautia – too high (lab agrees)
  • Bacteria deemed unhealthy

IMHO – See MD for Antibiotics!

These levels of Salmonella and Shigella are of conventional medical concern. Potentially, you could negotiate with the MD for antibiotics that are effective for them and which will also help your microbiome.

Going Forward

As is becoming my norm, “Just give me Suggestions” button runs 4 sets of suggestion that will usually produce good suggestions.

After doing this, we will hand pick the bacteria of concerns:

This is done using Microbiome Tree on my Profile

And add this to make 4 sets of suggestion. While these may already be selected in the other suggestions, this additional run will emphasis those suggestions more.

Consensus – antibiotics

The topic antibiotics suggested (considering everything) are:

Cross checking with Special Reports (which computes a different way), we find that both lists have many in agreement. This list is full of the antibiotics often prescribed by ME/CFS specialists.

AntibioticConfidence
tetracycline (antibiotic)s0.98
ciprofloxacin (antibiotic)s0.939
metronidazole (antibiotic)s0.93
amoxicillin (antibiotic)s0.721
rifaximin (antibiotic)s0.623
minocycline (antibiotic)s0.548
ceftazidime (antibiotic)s0.505
vancomycin (antibiotic)0.439
intesti-bacteriophage0.418
imipenem (antibiotic)s0.353

There are many antibiotics that are listed in the avoid list. If the MD is willing, I would suggest following the Cecile Jadin’s approach for antibiotics, single course of one antibiotic, a break, then a different antibiotic (preferable a different family).

Consensus – Other

The top ones of the non-antibiotics list are also familiar supplements to many ME/CFS patients. In decreasing priority:

Vitamin B12 and B2 are high priority.

Probiotic Rotation

I would suggest 2 weeks on one of these and then move onto the next one. Repeat at the end:

I would suggest (after discussing with your medical profession) to keep to the above for 2-3 months and then do a retest.  You are sailing your microbiome to safer waters though an archipelago. The winds and the charts will often require many course corrections.

Reader Feedback

From what I have seen of your recommendations, the conventional antibiotic treatment would be shorter than that of products such as oregano, thyme…

There is no doubt that I will talk to my doctor, precisely in a few days I have an appointment with my internal medicine doctor (infections) and I will take my test result so that if he wishes he can prescribe antibiotics, although I am afraid that taking them will further imbalance my microbiota but there is no doubt that possibly my digestive problems (abdominal pain) do not have their origin in irritable bowel syndrome or irritable colon and are produced by these bacteria that I may infect myself having worked in an infectious unit before falling ill .

I know of several MDs that specialized in treating ME/CFS patients who after a few years also came down with ME/CFS. Bacteria is easily transferred by skin contact, inhalation – in most cases, each exposure compound the very low odds of contagion from a single contact. Over time, the risk increases.

  • “Is CFS contagious? Because the cause of CFS remains unknown, it is impossible to answer this question with certainty. However, there is no convincing evidence” Wisconsin Department of Health
  • ” The chronic phase of ME/CFS does not appear to be particularly infective. Some healthy patient-contacts show immune responses similar to patients’ immune responses, suggesting exposure to the same antigen (a pathogen).” [2015]

Postscript – and Reminder

I am not a licensed medical professional and there are strict laws where I live about “appearing to practice medicine”.  I am safe when it is “academic models” and I keep to the language of science, especially statistics. I am not safe when the explanations have possible overtones of advising a patient instead of presenting data to be evaluated by a medical professional before implementing.

I cannot tell people what they should take or not take. I can inform people items that have better odds of improving their microbiome as a results on numeric calculations. I am a trained experienced statistician with appropriate degrees and professional memberships. All suggestions should be reviewed by your medical professional before starting.

The answers above describe my logic and thinking and is not intended to give advice to this person or any one. Always review with your knowledgeable medical professional.

Multiple COVID leading to Heart Issues?

Back Story

We’ve had COVID over half a dozen times since early 2020. My primary symptoms are fatigue, brain fog, and breathlessness/lack of endurance. But the full list of symptoms is long… It’s gotten so bad that I’m out of work. 

I felt brief but significant improvement with low-dose naltrexone, and with low-dose nicotine patches (wasn’t a fan of using that, but it was a successful experiment). 

We’re on a ton of supplements with the guidance of our doctors, but our symptoms are worse than ever, and getting worse with time. We think our microbiomes have been damaged, which the Biomesight results seem to agree with. 

Looking at what is reported for Long COVID, we have few matches:  (5 %ile) 24 of 212, but wtih   Coronary artery disease (93 %ile) 6 of 18. This hints at a different direction which the literature indicating that it is possible.

Patients with COVID-19 were at increased risk of a broad range of cardiovascular disorders including cerebrovascular disorders, dysrhythmias, ischemic and non–ischemic heart disease, pericarditis, myocarditis, heart failure, and thromboembolic disease.

The COVID Heart—One Year After SARS-CoV-2 Infection, Patients Have an Array of Increased Cardiovascular Risks [2022]

As well as Long-term cardiovascular outcomes of COVID-19 [2022].

Review

  • Potential Medical Conditions Detected has nothing of concern
  • Prevotella copri is at 88%ile indicating a significant risk of mycotoxin (from fungi) being present. We also have:
    • ”As with ongoing symptomatic COVID-19, multiple Prevotella species (38) are associated with long COVID. Prevotella species are overrepresented in patients with COVID-19 and are thought to produce proteins that can promote SARS-CoV-2 infection and increase clinical severity of COVID-19 (42).” which may account for the multiple COVID.
  • Dr. Jason Hawrelak Recommendations is at 99.9%ile with low Akkermansia and Bifidobacterium being main item of concern.

We have the typical over representation of bacteria in the 0-9%ile.

PercentileGenusSpecies
0 – 95373
10 – 191618
20 – 291122
30 – 391521
40 – 491523
50 – 591116
60 – 691522
70 – 792417
80 – 891317
90 – 9975

With the following being flagged of concern:

  • Roseburia – 99%ile and 17% of the microbiome
  • Ruminococcus bromii – 96%ile and 5.9% of the microbiome

Roseburia is reported to be decreased in several COVID studies [2021] [2022] [2023] hence the shifts are unlikely to be strongly COVID associated. Similarly a decrease of Ruminococcus is seen after COVID vaccination [2022]. Increases in Ruminococcus is reported in chronic heart failure patients [2018] and atrial fibrillation[2019]

Going Forward

Doing the “Just give Me Suggestions” and then looking at the consensus, we see diet changes at the top of the list:

In other words, lean meat diet.

The top probiotics are:

Going over to KEGG Derived: We see Escherichia coli on the top, with Lacticaseibacillus rhamnosus, Bifidobacterium bifidum, and lactobacillus salivarius being on the positive list (agreement on suggestions with two different algorithms)

I am inclined to suggest diet changes with rotating probiotics every 2 weeks (making sure that you have therapeutic dosages). Retest after 8 weeks and see where we moved to.

Bottom Line

The assumption of typical long COVID or ME/CFS were reasonable assumptions with no microbiome data. You may wish to review other reviews of Long COVID patients. see Analysis Posts on Long COVID and ME/CFS. However, when we add in microbiome data we do not find a match — instead we have indicators of possible cardiac issues arising out of COVID. I would suggest asking for an in depth analysis by your medical professional in this direction.

Microbiome and Vitamin D

For the last decade I have been citing literature for the appropriate dosage levels of Vitamin D. The RDA level is not sufficient for a healthy microbiome — it is sufficient only to stop rickets from occurring.

Some old citations from 2015 Post

  • “Several diseases have been linked to vitamin D deficiency, such as hypertension, diabetes, depression, Alzheimer’s disease, Parkinson’s disease, multiple sclerosis, and chronic pain syndromes such as fibromyalgia. ” [2013]
  • “Vitamin D deficiency was defined as a serum 25-hydroxyvitamin D concentrations ≤20 ng/mL (50 nmol/L). The overall prevalence rate of vitamin D deficiency was 41.6%,” [2011]
  • “Older adults are advised to maintain serum 25(OH)D concentrations >75 nmol/L.” [2006]
    • Dr. Mercola recommends 45-50 ng/ml or 115-128 nmol/l [source]
  • “Vitamin D intakes required to maintain serum 25(OH)D concentrations of  >80 nmol/L in 97.5% of the sample[of men and women aged 20-40 y] were … 41.1μg/d (1640 IU), respectively.” [2008]
  • “The clinical trial evidence shows that a prolonged intake of 250 mug (10,000 IU)/d of vitamin D(3) is likely to pose no risk of adverse effects in almost all individuals in the general population; this meets the criteria for a tolerable upper intake level.” [2007]
  • “Evidence from clinical trials shows, with a wide margin of confidence, that a prolonged intake of 10,000 IU/d of vitamin D(3) poses no risk of adverse effects for adults,” [2009]
    • NOTE: there was no evidence going 50% higher has any risks. The studies just tested the 10,000IU level.
  • “Vitamin D, important for maintaining bone health in Crohn Disease[CD], may have potential as a treatment for the core inflammatory disease process. There is plausible evidence in favour of vitamin D as an anti-inflammatory from animal models, epidemiological and cross sectional studies of CD.”[2015]
    • “Active Crohn’s disease was associated with low serum 25-OH vitamin D.”[2013]
    • “In addition, low vitamin D has been associated with disease activity in CD patients, and supplementation appears to be beneficial in improving clinical scores and reducing inflammation.” [2014]
    • “Vitamin D is an inexpensive supplement which has been shown to improve IBD outcomes.”[2014]
    • “people with IBD may remain in remission longer when treated with oral vitamin D…suggest that vitamin D may modify the immune response in IBD.” [2015]

And from my 2017 post:

  • “This study demonstrates for the first time a direct antiviral effect of vitamin D in an in vitro infectious virus production system.”[2011]
  • “vitamin D is the environmental factor that most strongly influences autoimmune disease development.”[2015]
  • “A significant negative correlation between vitamin D level and widespread pain index was found.”[2012] i.e. FM
  • Serum 25-Hydroxyvitamin D3 and BAFF Levels Are Associated with Disease Activity in Primary Sjogren’s Syndrome [2017].  “Female SS patients had significantly lower vit D levels  than controls” [2015]
  • “Our findings showed that the high-dose supplementation of vitamin D[9 of 50000 IU cholecalciferol capsules for 3 months taken at weekly intervals] affects measures of systemic inflammation: reductions in High-Sensitivity C-Reactive Protein level and Neutrophil-to-lymphocyte ratio (NLR) distribution.” [2017]
    • “The results of the meta-analysis of 10 trials involving a total of 924 participants showed that vitamin D supplementation significantly decreased the circulating hs-CRP level by 1.08 mg/L” [2014]

This is a good technical discussion: Vitamin D3 Deficiency Results in Dysfunctions of Immunity with Severe Fatigue and Depression in a Variety of Diseases [2014]

I mentioned a formula from 2010 in the first post. Fortunately, there are several Vitamin D calculator available. I put in the numbers from the above post below

Use: https://www.grassrootshealth.net/project/dcalculator/

The numbers agree with my 2015 calculated example. 10,000 IU/day over 3 months

The factor not considered is age. Vitamin D absorption decreases with age;

In addition to classic role of vitamin D in musculoskeletal health over the last decade it was shown that low blood serum concentrations of 25(OH)D are associated with a number of non-skeletal disorders including cancer, high blood pressure, age-related cognitive decline, disorders of the immune and reproductive systems, etc. The prevention of the development of these diseases is reached under considerably higher concentrations of the vitamin in the blood serum, than is necessary to maintain the normal state of the bone tissue, to regulate calcium absorption and homeostasis

[Physiological needs and effective doses of vitamin D for deficiency correction. Current state of the problem [2017]

“Vitamin D was first discovered as the curative agent for nutritional c, and its classical actions are associated with calcium absorption and bone health. However, vitamin D exhibits a number of extra-skeletal effects, particularly in innate immunity. Notably, it stimulates production of pattern recognition receptors, anti-microbial peptides, and cytokines, which are at the forefront of innate immune responses. They play a role in sensing the microbiota, in preventing excessive bacterial overgrowth, and complement the actions of vitamin D signaling in enhancing intestinal barrier function. Vitamin D also favours tolerogenic rather than inflammogenic T cell differentiation and function. Compromised innate immune function and overactive adaptive immunity, as well as defective intestinal barrier function, have been associated with IBD. Importantly, observational and intervention studies support a beneficial role of vitamin D supplementation in patients with Crohn’s disease, a form of IBD. This review summarizes the effects of vitamin D signaling on barrier integrity and innate and adaptive immunity in the gut, as well as on microbial load and composition. Collectively, studies to date reveal that vitamin D signaling has widespread effects on gut homeostasis, and provide a mechanistic basis for potential therapeutic benefit of vitamin D supplementation in IBD.”

Vitamin D signaling in intestinal innate immunity and homeostasis [2017]

There is no appropriate dosage to take without lab results. I know females over 50 that freaked out their physician when they stated that they were taking 20,000 IU of vitamin D3 daily for the last 2 years. Lab tests were quickly ordered!! The lab tests showed her just above the middle of the normal range. The ability to absorb is significantly reduced with IBS, IBD, UC, Crohn’s disease, etc. It’s a matter of getting the labs, take an aggressive dosage for 6 months, retest and then adjust the dosage according to the new results.

“The biggest problem is that MDs are often behind the times and do not work from the latest literature.  For example a single dosage of 600,000 IU of vitamin D is deemed safe on medscape, or 10,000 IU/day for months [source]. One of the studies above cited an average of 60,000 IU/day for 3 months!  [2017]”

From my 2017 post

Target Dosages?

At least 128 nmol/l or 50 ng/mL. You want to be at the TOP of the normal range. You will get push back from MD with higher level because of medical myth that above this is toxic. I say myth because there is no evidence in the literature. There were issues with Vitamin D2 supplements which was sold for a while because it was cheap to produce and is chemically different.

Of 20,308 measurements, 8 percent of the people who had their vitamin D measured had levels greater than 50 ng/mL, and less than 1 percent had levels over 100 ng/mL.

“We found that even in those with high levels of vitamin D over 50 ng/mL, there was not an increased risk of hypercalcemia, or elevated serum calcium, with increasing levels of vitamin D,” says study co-author Thomas D. Thacher, M.D., a family medicine expert at Mayo Clinic. [2015]

Of course, there are some rare DNA mutations that could cause problems with that level. One person’s experience with the details. If you have adverse reaction — get the additional tests described below.

Vitamin D Is Not as Toxic as Was Once Thought: A Historical and an Up-to-Date Perspective [2015]

“(Obese adults require doses 2-3 times higher.)”

“The evidence is clear that vitamin D toxicity is one of the rarest medical conditions and is typically due to intentional or inadvertent intake of extremely high doses of vitamin D (usually in the range of >50,000-100,000 IU/d for months to years).”

Medical Conditions: Links between Conditions

This builds on Medical Conditions with Microbiome Shifts from US National Library of Medicine page where the bacteria shifts for various conditions are summarized. The question often is asked, “Did my Asthma caused my depression?” or other mixtures.

If the US had a unified medical system recording information from birth until the grave, then such questions can be answered by some database queries by a skilled statistician. Unfortunately, that is not the case and access to such data is often challenging because of privacy laws.

There is an approach that may hint at answers. Look at the bacteria and direction of shifts reported for various conditions and see if there are good matches. For example, you have 10 of the shifts seen for being afraid of dogs and there are 15 shifts seen in people that are afraid of pets. You would appear to be 10/15 = 66% of the way to that other condition.

The challenge is sparse data. For some conditions we have had lots of microbiome studies and for others almost none. We can view it as shown below.

The more the bacteria are in common, the more likely you may drift from one condition to another — often added as a co-morbid condition.

Looking at this data is available on the Medical Conditions with Microbiome Shifts from US National Library of Medicine page

Clicking will take you to a page that lists the percentage overlap and show a visualization with arrows thickness reflecting the percentage overlap. Remember that many conditions also require DNA mutations to cause the condition. This is NOT predictive, merely a factor to consider.

At the top, you can pick a different condition, set the percentage association to show (the lower the amount, the more items will appear and you may get a very busy page). Or, go over to every thing on one page.

Looking at what could cause Asthma, we see the key contributors.

When you hover over the line, you will get more information, for example Chronic Lyme. We see that we only have 3 bacteria types/taxon listed for Chronic Lyme (at this time),

Looking at Sleep Apnea, we see more bacteria are known about it.

You must balance the number of bacteria (taxons) with the percentage. High taxon counts with high percentage are likely significant. The issue keeps coming down to few studies on microbiome shifts.

Note: The numbers and charts will change over time as more data is found and entered.

Endometriosis (infertility), Microbiome and COVID

The coordinator of a UK Long COVID group asked me to research and post on this topic. Endometriosis is one form of infertility that has a prevalence around 7%. When I checked the US National Library of Medicine for Endometriosis and microbiome, I found 88 studies most published in 2021 and later. It is a newly discovered association. I have added it to my PubMed Study page with bacteria listed here and a priori changes of diet to counter these shifts listed here.

I repeated searching the US National Library of Medicine for Endometriosis and microbiome for endometriosis and COVID. I found 66 studies — a volume that surprised me! A few studies that appear interesting:

From The effect of SARSCoV2 BNT162b2 vaccine on the symptoms of women with endometriosis.

Concurrence between Microbiome Shifts

From the database I compared shifts between COVID and endometriosis, with the shift in common shown below.

Tax NameTax RankShift
CoriobacteriaceaefamilyHigh
EnterobacteriaceaefamilyHigh
AtopobiumgenusHigh
BacteroidesgenusHigh
BifidobacteriumgenusHigh
BlautiagenusHigh
CampylobactergenusHigh
CandidagenusHigh
CorynebacteriumgenusHigh
DialistergenusLow
EscherichiagenusHigh
FaecalibacteriumgenusHigh
LachnospiragenusLow
LactobacillusgenusLow
OdoribactergenusLow
ParabacteroidesgenusHigh
ParaprevotellagenusLow
PrevotellagenusHigh
PseudomonasgenusHigh
RuminococcusgenusLow
ShigellagenusHigh
StreptococcusgenusHigh
EubacterialesorderLow
ActinobacteriaphylumHigh
FirmicutesphylumHigh
ProteobacteriaphylumHigh
VerrucomicrobiaphylumHigh

Can COVID cause Endometriosis

There is no clear evidence of that, but the table of common shifts implies that it is a reasonable hypothesis. Looking at numbers from Long COVID groups, you may see over representation (above the 7% expected). Endometriosis increased the odds (almost double) of getting COVID then seeing 14% of Long COVID population with Endometriosis could be explain by the increase risk of getting COVID.

On the brighter side, we now see that endometriosis has a significant microbiome dimension and thus treatment by microbiome manipulation becomes an option worth exploring.

Long COVID with Mast Cell Issues?

Backstory

I’m in my early thirties and I caught COVID in November 2022. I’ve had dizziness from the beginning which is slowly going away, shortness of breath which is going away, weakness and pains all across my body, numbness, and this general feeling of derealization. Some days it felt I couldn’t even walk up the stairs. After extensive testing it was revealed that i had EBV reactivated, toxic mold, and whatever damage was left from long COVID. The big symptom that I’m still dealing with to this day are some sort of MCAS presentation where when i eat high histamine foods, exercise, sauna, or go for too long of a walk my throat will get tight, which is pretty scary. I also get dizzier upon anaerobic exercise. 

For other analysis for Long COVID click here.

Analysis

We again see the typical pattern for Long COVID and ME/CFS. Over representation of the 0-9%ile. For more information see Background on using this approach

PercentileGenusSpecies
0 – 977101
10 – 192420
20 – 291618
30 – 391118
40 – 491227
50 – 591219
60 – 691512
70 – 79415
80 – 891319
90 – 991924

In this case we see a number of bacteria flagged as likely causes of the above.

RankBacteriaImportancePercentile
genusBacteroides495%ile
speciesBacteroides stercoris3.2100%ile
speciesPhocaeicola vulgatus394%ile
genusRuminococcus2.793%ile
genusMediterraneibacter2.299%ile
speciesRuminococcus gnavus2.299%ile
genusEscherichia2.299%ile
genusMitsuokella2.1100%ile
speciesMitsuokella multacida2100%ile
High Bacteria

Comparing to the COVID Literature

Going over to Understanding the Relationship of the Human Bacteriome with COVID-19 Severity and Recovery [2023] We see the following cited as being higher: Mediterraneibacter. And Gut microbiota and COVID‐19: A systematic review [2023] cites higher Bacteroides stercoris, Phocaeicola vulgatus, Ruminococcus, Ruminococcus gnavus, Escherichia. Interesting that Gut microbiota in COVID-19: new insights from inside [2023] cites that Mitsuokella decreases with recovery. Our hope is that we will see this drop with our suggestions – there is only one known reducer: Nicotine.

Looking at the standard quick health overviews, we see a massive number of bacteria of concerns. While many are of low count, they are much higher than usually seen. This is in agreement with the over representation of the 0-9%ile range.

We see similar red flags with Dr. Jason Hawrelak Recommendations

Going Forward

There are so many items of concern that most practitioners would really not know where to start. Fortunately, the Artificial Intelligence engine was built to handle such complexities. Doing the quick route, I clicked the “Just Give Me Suggestions” and then click on the more technical details which takes us over to the consensus report.

The Consensus Report is done using all possible modifiers, including antibiotics and prescription drugs (that we have information on their microbiome impact). The quick suggests auto-picks items commonly used in treating ME/CFS and Long COVID.

The top suggestions are high in antibiotics, which is atypical.

Getting antibiotic prescribed off-label is a challenge.

Reader’s Question: “Any idea how to go about getting those prescription antibiotics? “

Ideally, you can get your primary care physician to be willing to prescribe one of those above. It does not need to be the first one. If the physician suggests something not on the list, use the filter feature to see it estimated benefit. Negotiate. I attach an article on Long COVID from this week’s edition of New Scientist.

Some practitioners may be uncooperative — there are several alternative approaches.

  • Look for a naturopath or MD that deals with Lyme infections. It is unlikely that you have Lyme BUT the gut disruption will often result in some Lyme tests returning a false positive. Getting that positive, even a weak one, will rationalize to that practitioner the prescription of antibiotics. Some of those listed above are used by Lyme physicians.
  • The following are not recommended but people have reported doing these approaches:
    • If you live near the Mexican border, many of the antibiotics are available there without prescription.
    • See if you can order directly from Vet Supply shops
    • If you have friends travelling to Mexico (or India or many 3rd world countries), they could buy at local pharmacies and bring it home to you.
  • The best way is always under medical supervision!

How to explain to your MD on how these suggestions are computed?

We have been developing an Artificial Intelligence program based on the pattern of the 1972 MYCIN system developed by Stanford University in California. Unlike the popular AI systems based on machine learning or large language models (Chat GPT), we use Probabilistic Inductive Logic Programming with over a million facts manually curated from the U.S. National Library of Medicine.  

LInks to more information are in above quote

Not walking the Prescription Path

Fortunately, we also have some herbs and species listed near the top. These include the following

And a few specific probiotics

I have no financial interest in Custom Probiotics — they are just by far the cheapest per BCFU and advocate therapeutic dosages.

I would encourage you to look at the avoids and remove the high value items. See video below.

I would not be surprised if you have a Jarisch–Herxheimer reaction from some of the above. I usually advocate the Cecile Jadin approach which is to take one or two items at a time for up to 2 weeks and then rotate to other items. Start with a low dosage and slowly work up the dosage. This will usually reduce the risk of a strong herxheimer reaction. This approach reduces the risk of antibiotic (or equivalent) resistance happening. There will always be a bacteria mutations that will tolerate specific herbs, probiotics and antibiotics. The odds of the bacteria tolerating multiple substances is very low.

I would suggest doing the rotating suggestions for 8 weeks and then retest. Always use the same lab so comparisons are valid.

Video Walkthru

Postscript – and Reminder

I am not a licensed medical professional and there are strict laws where I live about “appearing to practice medicine”.  I am safe when it is “academic models” and I keep to the language of science, especially statistics. I am not safe when the explanations have possible overtones of advising a patient instead of presenting data to be evaluated by a medical professional before implementing.

I cannot tell people what they should take or not take. I can inform people items that have better odds of improving their microbiome as a results on numeric calculations. I am a trained experienced statistician with appropriate degrees and professional memberships. All suggestions should be reviewed by your medical professional before starting.

The answers above describe my logic and thinking and is not intended to give advice to this person or any one. Always review with your knowledgeable medical professional.

Predicting Conditions from PubMed Studies

I have an extensive collection of bacteria shifts reported from Studies on the US National Library of Medicine Studies for some 91 different conditions.

My past practice has been to deem over 75%ile to be a match if the study reported high and below 25%ile if the study reported a low. I then compute the number of hits for all samples and determine each person’s percentile. I then look at the reported incidence of the condition and see if there is a likely match.

For example, the condition is seen in 5% of the population: one person is at 45%ile – thus unlikely; another person is at 95%ile – thus borderline; a last person is at 99%ile – thus likely.

These 25%ile and 75%ile were arbitrary numbers point out of the air. I dislike arbitrary numbers. This attempts to find better numbers supported by evidence.


The root problem is that the study typically reports that the average of people with a condition is statistically different from the control group. This means that the only clear fact is whether the sample of people with this condition is higher or lower than the control group. This cannot be applied to an individual because the average is the average of a population with a wide range of values reported.


I looked at current available data and picked Depression to use for some test runs. We have 298 samples that are annotated with depression, and 226 different bacteria-shifts from studies). We divide our population into those that annotated with depression and those that annotated their sample but did not include depression.

  • Ombre reports 166 of the 226 bacteria from studies
  • BiomeSight reports 147 of the 226 bacteria from studies
  • uBiome reported 154 of the 226 bacteria from studies

This implies that Ombre may produce the best results, uBiome with intermediate, and Biomesight the worst.

The method is easy, finding the number of matches per sample for with depression and without depression. Then get the ratio between them. If the percentage is below 100, then we have false positives. We want the numbers to be over 100%. After going through the numbers, I came up with 109% as being a good threshold.

My first run was aggregating all lab data. We see good discrimination using 6%ile/94%ile. This drops almost in half at 10%ile/90%ile and disappears at 40%ile/60%ile. Aggregating all samples together has usually resulted in reduced statistical significance.

PercentileWithWithoutRatio
11.281.14112%
22.552.31111%
33.703.39109%
44.894.44110%
56.055.54109%
67.136.57109%
78.127.63106%
89.258.75106%
910.329.80105%
1011.4110.80106%
1517.1116.48104%
1921.2920.75103%
2932.1631.58102%
3033.1132.70101%

The next runs are being lab specific:

  • Biomesight:
    • 78 with depression,
    • 637 without depression.
    • We use a criteria of a ratio of 109% or better, so 6%ile/94%ile
PercentileWithWithoutRatio
11.261.10115%
22.862.48115%
33.993.57112%
45.224.68111%
56.475.82111%
67.686.87112%
78.517.96107%
  • Ombre Labs:
    • 78 sampleswith depression,
    • 340 samples without depression

The results blew me away! I give a possible explanation below.

PercentileWithWithoutRatio
10.750.8786%
22.091.05199%
33.421.70202%
45.052.32217%
56.603.00220%
68.193.61227%
79.594.27225%
810.974.93222%
912.445.57223%
1014.056.20226%
1115.546.85227%
1217.047.57225%
1318.888.23229%
4874.2331.98232%

And going to the defunct uBiome:

  • With: 103 Samples
  • Without: 376 Samples

It looks like using 22%ile and 78%ile yields a 109% ration or better.

PercentileWithWithoutRatio
11.751.32132%
23.092.06150%
34.302.89149%
45.303.73142%
56.324.64136%
67.175.59128%
78.206.48127%
89.327.37126%
910.358.30125%
1011.199.20122%
1112.1710.18119%
1213.1211.11118%
1314.1312.01118%
1415.1412.91117%
1516.1313.83117%
1616.9714.76115%
1717.8215.74113%
1818.7616.63113%
1919.6417.52112%
2020.4318.45111%
2121.3619.44110%
2222.1620.35109%
2323.0021.28108%
2424.0022.31108%
2524.9323.24107%
2625.9224.18107%
uBiome

Why does Ombre Labs blow away other Labs?

First, you need to understand the back story read The taxonomy nightmare before Christmas…[2019]. There is NO STANDARDIZATION. Different labs use different reference libraries. I would speculate that the reference libraries typically used for studies on the US National Library of Medicine is much closer to the reference libraries used by Ombre than those used by Biomesight.

It could be roughly compared to the studies using metric Bolts. Ombre nuts are metric (cm) and thus fit well. Biomesight nuts are imperial (inches), they do not fit as well, and on occasion may need to be forced. That is the likely nuts and bolts of it.

What does this mean for Predictions using PubMed Studies?

At the simplest level it means that my criteria for matching is different for each lab.

  • High is over 60%ile and Low is under 40%ile for Ombre
  • High is over 94%ile and Low is under 6%ile for Biomesight
  • High is over 78%ile and Low is under 22%ile for uBiome
  • Other labs: High is over 94%ile and Low is under 6%ile for Biomesight

We ended up with the same best to worst order for labs as predicted at the start — except the differences is a lot larger than I expected. It will likely take a week for me to modify the build processes and have numbers on Microbiome Prescription updated.

What about to Shotgun analysis (Thorne, Xenogene)? Answer is simple, we need a lot more samples from both of them.

Testing Discrimination Performance

I charted the with versus without depression for various labs below to see how strong the discrimination was. The charts are below with uBiome showing the best discrimination. At higher percentiles, ubiome is 3-4x more likely to detect depression over a not depression.

This hints that we need to reduce the percentiles

More work to do…

Environment and the Microbiome – PM2.5 is BAD

After a Facebook post, the post got this message. This post is a fuller answer

I will skip over the obvious impact of fungi and mold in your environment (home, car, work) on the microbiome. Pollutants impacting the microbiome and the immune system in well documented in recent studies.

For one condition that has been studied, pollution has a life-long impact, even if the exposure was for a relatively short period of time.

What can you do to limit the adverse impact?

The first step is to monitor. Know where there is an issue. We use two monitors – one outside and one inside. If I was working in the office daily, I would also have one there. Possibly a fourth one for how I commute to work (for example mold in the car). The cost was not much (buying from aliexpress.us $26 each) – and this model has an internal rechargeable battery (ideal for the commute).

The second step is to take the data and do something with it. Some examples for inside:

  • Use air-filters to reduce particle matter (PM) levels
  • Use activate-carbon filters to reduce:
    • Formaldehyde (HCHO)
    • Total Volatile Organic Compounds (TVOC).
  • Use dehumidifier to reduce humidity (a factor for mold)
  • Be aware that new items delivered could off-gas!!
    • We use an external shed with an ozone generator to reduce organic compound / perfumes / smells. Ozone breaks down TVOC and HCHO quickly.

For outdoor and home location,

  • If you work outside, you may wish to wear a half or full face mask with a N-95 or P-100 filter (we use P-100 as our standard). The half face mask gives a tight seal to the face.
    • In our area during the winter, many people still burn wood — you can see it on the outside meter before you can smell it.
  • You may wish to check the seals on doors and windows. Replace or improve them to reduce air leakage (and also save heating bills!). In some cases, you may want to consider removable masking tape (“the blue stuff”) to improve the seal.
    • If your furnace has an external air intake, you may wish to add filters on the intake.
  • Because of past wildfire smoke issue, we added in the attic a fan with good HEPA Activated Carbon filter to give the house a positive air pressure when needed. I.e. Only filter air comes in and seals that would allow pollutants to leak in, now exits our filtered air.
Left end is the filter, the fan engine and then a vent into the house.
  • One of the best solution is to move to a location with good air quality. There are resources on line to evaluate locations. We used them extensively before our last move.

From AirNow

For the world https://waqi.info/ Australia is above

If you have the option or desired to move — be aware of sources of pollutants at proposed places. Do an in depth investigation of the patterns for the whole year. We have a petrochemical plant to the north and one to the south – but we have a west to east wind pattern and located in a north-south valley. We also look at flood risk and marsh lands — both are high mold and fungi risks.

That’s the long and the short of it:

  • Studies showing that it is important
  • Tools to monitor
  • Our experience reducing the impact on our microbiome.

MCAS and Long COVID – Some Questions

Hey Ken. At a talk last night by a functional med/environmental doc, she said that recent research has shown that 21% of the population has MCAS (Mast Cell Activation Syndrome). Apparently, she said, MCAS is finally being recognised by the medical profession. She went on to say that if someone with MCAS gets Covid, they almost always get Long COVID. Can you draw any conclusions between the microbiome and MCAS as you have with other conditions, and maybe relate it to your other research into Long Covid?

The joy of a citizen science site with lots of contributed data is that we can get informal insight. For more information about the probable bacteria involved see Multiple Chemical Sensitivity (MCS) – A Cause Found?

Q: Does 21% of the population has MCAS (Mast Cell Activation Syndrome)?

A: We have 336 samples annotated with MCAS or histamine issues out of 1747 annotated samples. That is 19.2%. Conclusion: We are in agreement with the research.

Q: if someone with MCAS gets COVID, they almost always get Long COVID?

A: This is a bit of a chicken and an egg question. People with CFS/ME gets MCAS. Looking at uploads prior to Long COVID appearing, we actually have 30.5% of all samples with MCS; 16.5% of samples with ME/CFS (104). The incidence of MCAS in this ME/CFS population was 58%.

We have 190 samples annotated with Long COVID but only 13 reporting MCAS. My conclusion is that all of the people she saw with MCAS were borderline ME/CFS or ME/CFS already. A likely correct statement is that someone with ME/CFS and MCAS is likely to get Long COVID. All that COVID is likely to do is to push the person further into the ME/CFS spectrum. We cannot separate Long COVID from ME/CFS.

Doing filtering of people with MCAS without ME/CFS and then Long COVID, we get a 6.4% incident rate. This suggests that MCAS without being comorbid with ME/CFS does not always get Long COVID.